The problem in brief
A warm-up task from the Romanian AI olympiad's first OJIA simulation round (2025). For 100 past deliveries you know the distance, the parcel's weight, the traffic level (1 to 14) and whether the parcel arrived on time. For 50 new deliveries you must (1) report the mean and (2) the standard deviation of their traffic level, and (3) predict on time or delayed for each one. The official Nitro judge needs a login, so we used the public mirror of the round in the jaredliw/ioai-tsp-2025 repository, which contains the same statement, data and starter kit. The 50 test labels are private.
How you are scored
- Subtasks 1 and 2 (20 points each): full points if the answer is within 0.02 of the committee's value.
- Subtask 3 (60 points), from the accuracy on the 50 test deliveries:
Full marks need : with 50 rows, that means at most one mistake. Accuracy 0.8 or below gives 0.
First look at the data
The 100 training rows are balanced (51 on time). Each feature correlates strongly with the label (about ) and with the others (0.7-0.8). Plotting them shows why:
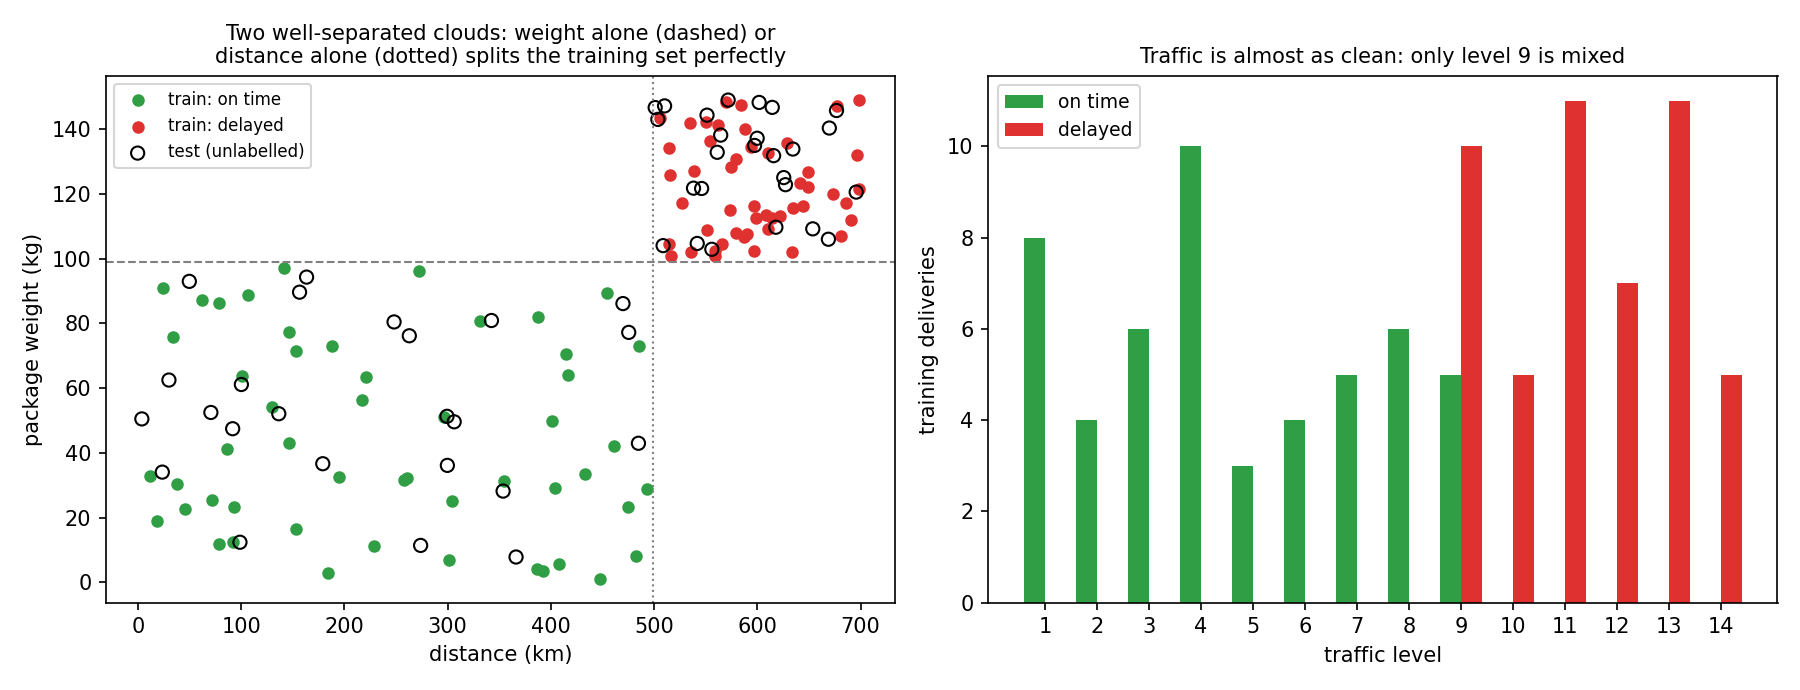
The data is two well-separated clouds. On-time parcels are light (1-97 kg), travel short distances (11-493 km) and face light traffic (1-9). Delayed parcels are heavy (101-149 kg), far (506-699 km) and face heavy traffic (9-14). Weight alone, or distance alone, separates the training set perfectly, with a gap of 3.6 kg and 12 km. Traffic is clean except at level 9, which appears in both classes.
A first baseline
Always predicting the majority class gives 51 %, which scores 0 points. A single threshold, "on time if weight ≤ 99 kg", gets 100 % of the training set right. It is the simplest model consistent with the data, and it is already the answer we keep for comparison.
The key idea
When classes are separated with a margin along several features at once, any reasonable classifier finds the same boundary, and the only real risk is a test point falling in the gap. We check that risk directly on the test set:
- the test weights also split into two groups with a gap (94.3 kg, then 102.9 kg), and so do the distances (at most 485 km, then at least 501 km);
- a logistic regression, a random forest, an RBF-SVM, the weight rule and the distance rule produce exactly the same 50 predictions (24 on time, 26 delayed). Even an unsupervised 2-cluster K-means on the three standardised features agrees on 49 of 50.
When independent models built on different features agree everywhere, the predictions are very unlikely to hide more than the single error the scoring tolerates. The test points falling in the gap would be the risk, and there are none.
The trap is in subtask 2. "Standard deviation" has two versions, and on these 50 values they differ by more than the 0.02 tolerance:
The organisers' starter code works in pandas, whose std() defaults to the sample version (ddof = 1), so we answer 3.56. NumPy's np.std defaults to the population version and would give 3.52, which is outside the tolerance if the committee used pandas. The statement does not say which one it means. When it is ambiguous, pick the convention of the tools the organisers use, and say so.
The full solution
- Subtask 1:
test.traffic_level.mean()= 8.02. - Subtask 2:
test.traffic_level.std()= 3.56 (sample standard deviation). - Subtask 3: standardise the three features, fit a logistic regression (, almost unregularised, since the data is separable), and predict the 50 test rows.
Results
| approach | repeated 5-fold CV accuracy (train) | test predictions |
|---|---|---|
| majority class | 0.51 | all on time |
| rule: weight ≤ 99 kg | 1.00 (on all 100 rows) | 24 on time |
| decision tree, depth 2 | 0.996 | |
| RBF-SVM | 0.998 | identical to logistic regression |
| random forest | 1.000 | identical |
| logistic regression (final) | 0.997 | 24 on time, 26 delayed |
| K-means, 2 clusters (no labels) | agrees with 98 % of train labels | 49 / 50 identical |
Subtasks 1 and 2: 8.02 and 3.56. The official test accuracy is unknown. Cross-validation and the agreement of five different classifiers make 60/60 very likely. Our expected total is 100 if the committee used the sample standard deviation, and 80 if it used the population one.
What to remember
- Plot before modelling. Here a single scatter plot shows that the problem is two separated clouds, which tells you that any reasonable model will do and that the real risk lies elsewhere.
- Use the agreement of diverse models as an uncertainty check on an unlabelled test set: a model on another feature, an unsupervised clustering. Agreement everywhere means low risk. Disagreements show you exactly which rows to look at.
- Read the scoring formula. Full marks at 0.978 on 50 rows means "at most one error", and a tolerance of 0.02 on a standard deviation makes ddof = 1 versus ddof = 0 a real 20-point decision.
- pandas
std()is ddof = 1, NumPynp.stdis ddof = 0. Know your defaults.