← Back to the problem

Romania ROAI 2025 · Correction by IOAI Training

Credit Score

This page gives the full approach. Read it once you have searched.

Metric
exact answers + accuracy
Evaluated on
held-out validation (official test labels are private)
Our score
0.828 accuracy; 44207, 4106, 8, 109
Expected level
accuracy >= 0.75 for the full 80 points

Expected level reached

We solved the problem ourselves: downloaded the data, ran the experiments and measured the score below. The statement and data belong to their organisers.

The problem in brief

A bank gives you one row per customer and per month (January to August): age, occupation, income, salary, number of accounts, cards and loans, payment delays, debt, credit history length, payment behaviour, and so on. The target is the customer's credit score: poor (−1-1), standard (00) or good (11). Four warm-up questions ask for simple statistics on the training table (44,207 rows), then you must predict the score of the 8,841 test rows. The data is famously dirty: numbers with stray underscores ("45_"), placeholders ("10000", "_", "NM"), impossible ages, garbled social security numbers.

How you are scored

Subtasks 1 to 4 are exact answers worth 4, 5, 5 and 6 points. Subtask 5 is scored by accuracy in steps: below 0.4 nothing, then 10, 25, 55 and 65 points for [0.4,0.5)[0.4, 0.5), [0.5,0.6)[0.5, 0.6), [0.6,0.7)[0.6, 0.7), [0.7,0.75)[0.7, 0.75), and the full 80 points for accuracy ≥0.75\ge 0.75 (statement, "Scoring"). Test labels are private: we validate on a held-out 20 % of the training rows.

Subtasks 1 to 4

subtaskquestionanswer
1number of rows of train_data.csv44207
2floor of the mean Monthly_Inhand_Salary over rows with Credit_Utilization_Ratio ≥25\ge 254106
3number of distinct Month values8
4number of distinct SSN values ending in "20"109

For subtask 2, both columns are clean floats with no missing value (40,458 rows qualify), and "floor" means rounding down, so int(np.floor(...)). For subtask 4, compare strings: ssn.str.endswith("20"), then count unique values (a customer appears in several months with the same SSN). The garbage SSNs such as #F%$D@*&8 never end in "20", so they need no special handling.

First look at the data

Two observations shape the whole solution.

The split is by row, not by customer. Each customer has up to 8 monthly rows, and the test rows were drawn at random among them: 99.0 % of the test rows belong to customers who also have rows in the training set, with their labels.

A customer's score is very stable. Take every pair of training rows of the same customer and check whether their scores are equal:
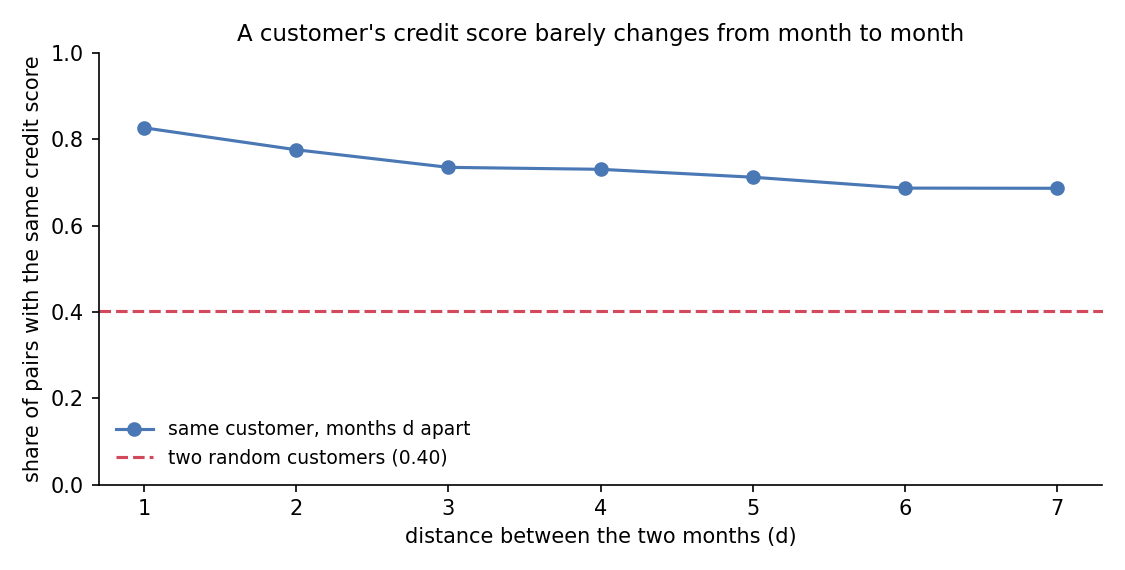
Share of pairs of rows with the same credit score, for the same customer, as a function of the distance in months: 0.83 for consecutive months, slowly decreasing to 0.69 for months 7 apart, far above the 0.40 agreement of two random customers.

Consecutive months agree 83 % of the time, against 40 % for two random customers. So for a test row, the labels of the same customer in nearby months are a very strong hint, and they are legitimately available: they are part of the training data.

The dirt is mostly per row: a customer whose age is 34 in seven months shows "844_" in the eighth, or 1,500 bank accounts once. Since the true value of these attributes is constant (or slowly varying) for one customer, the median over the customer's rows is a robust fix.

A first baseline

Predicting the majority class (standard) gives 0.526 accuracy (25 points). Gradient-boosted trees (HistGradientBoostingClassifier) on the cleaned row features alone reach 0.752, already just above the full-score line, but with no margin.

The key idea

Two pieces of information live at the customer level rather than in the row:

  1. Customer medians of each numeric attribute. They undo the random corruption of individual rows. This lifts accuracy to 0.777.
  2. The labels of the customer's other months. For each row we compute, from the other labelled rows of the same customer: how many were poor, standard and good, their mean, and the label of the nearest month (and how far it is). This is a form of target encoding at the customer level, and it brings the accuracy to 0.828.

Is this a leak? No: the test rows' customers really do have labelled months in the training file, and the statement does not forbid using them. But the validation must reproduce the situation honestly. For the held-out 20 %, the label features are computed only from the other 80 %, and for training rows the row's own label is always excluded (otherwise the model would learn "the answer is in the feature" and fail at test time). At test time, the features use all training rows, so the test should be at least as good as our validation.

The full solution

  1. Clean: strip underscores and convert to numbers; set impossible ages and the "10000" investment placeholder to missing; turn "13 Years and 10 Months" into 166 months; encode months, occupations, credit mix, minimum-payment flag and payment behaviour as categories; turn the loan list into 8 indicator columns.
  2. Customer medians of every numeric column, and the customer's most frequent known credit mix.
  3. Customer label features (leave-one-out, from labelled rows only): counts per class, mean, nearest-month label and distance.
  4. Model: HistGradientBoostingClassifier(max_iter=400, learning_rate=0.06), which handles the remaining missing values natively.
F["cust_n"]    = cust.map(K.groupby("cust").size()).fillna(0) - own.notna()      # exclude the row itself
F["cust_mean"] = (cust.map(K.groupby("cust").y.sum()).fillna(0) - own.fillna(0)) / F["cust_n"]

Results

Accuracy on a random 20 % of the training rows (8,841 rows, like the test):

approachaccuracypoints / 80
majority class0.52625
label of the customer's nearest labelled month (97 % coverage)0.77580
gradient boosting, cleaned row features0.75280
+ customer medians of the features0.77780
+ labels of the customer's other months (final)0.82880

With subtasks 1 to 4 correct, the expected total is 100 points. Note how strong the one-line rule "copy the nearest month's label" is (0.775): it beats a full model on the row features, a sign that the structure of the data matters more than the algorithm.

What to remember

  • Check how train and test were split. A row-level split of panel data (several rows per entity) means the same entities appear on both sides; their other rows are then the most valuable information you have.
  • Target encoding must be leave-one-out, and the validation must compute it from the training part only, exactly as at test time.
  • Fix dirty values at the level where the truth is constant: a per-customer median repairs corrupted ages or account counts better than any global imputation.
  • Compare with simple rules: "same as last month" is a baseline any model must beat.
  • For warm-up questions, read them literally: string matching for "ends with 20", unique values when asked for unique values, floor when asked for the integer part.
Full code (solution.py)
"""Credit Score (ROAI 2025, OJIA simulation 1).

Subtasks 1-4: simple statistics. Subtask 5: 3-class credit score (-1 / 0 / 1), scored by accuracy.

Key facts: the table is the (dirty) Kaggle credit-score data, one row per customer and month, and the
train/test split is by ROW, so 99 % of test customers also have labelled months in train. A customer's
score is very stable over time, so the labels of the same customer's other months are the strongest
feature. Messy numeric columns ("45_", "__10000__", absurd outliers) are cleaned and replaced by
per-customer medians.

Validation: random 20 % of train rows held out (like the test), label features computed from the
other 80 % only. Run from the folder holding train_data.csv and test_data.csv.
"""
import numpy as np
import pandas as pd
from sklearn.ensemble import HistGradientBoostingClassifier
from sklearn.metrics import accuracy_score

tr = pd.read_csv("train_data.csv", low_memory=False); te = pd.read_csv("test_data.csv", low_memory=False)
MONTHS = ["January", "February", "March", "April", "May", "June", "July", "August"]
NUM = ["Age", "Annual_Income", "Monthly_Inhand_Salary", "Num_Bank_Accounts", "Num_Credit_Card", "Interest_Rate",
       "Num_of_Loan", "Delay_from_due_date", "Num_of_Delayed_Payment", "Changed_Credit_Limit", "Num_Credit_Inquiries",
       "Outstanding_Debt", "Credit_Utilization_Ratio", "Total_EMI_per_month", "Amount_invested_monthly", "Monthly_Balance"]

# ---------------- subtasks 1 to 4 ----------------
s1 = len(tr)
s2 = int(np.floor(tr.loc[tr["Credit_Utilization_Ratio"] >= 25, "Monthly_Inhand_Salary"].mean()))
s3 = tr["Month"].nunique()
ssn = tr["SSN"].astype(str)
s4 = ssn[ssn.str.endswith("20")].nunique()
print("subtasks 1-4:", s1, s2, s3, s4)

# ---------------- cleaning and features ----------------
ALL = pd.concat([tr, te], ignore_index=True)
is_train = ALL["Credit_Score"].notna().values
y = ALL["Credit_Score"]


def clean(d):
    X = pd.DataFrame(index=d.index)
    for c in NUM:                                            # "45_" -> 45, "__10000__" -> 10000, junk -> NaN
        X[c] = pd.to_numeric(d[c].astype(str).str.strip("_"), errors="coerce")
    X.loc[(X.Age < 0) | (X.Age > 100), "Age"] = np.nan
    X.loc[X.Amount_invested_monthly >= 10000, "Amount_invested_monthly"] = np.nan   # placeholder value
    h = d["Credit_History_Age"].astype(str).str.extract(r"(\d+) Years and (\d+) Months").astype(float)
    X["hist_months"] = h[0] * 12 + h[1]
    X["month"] = d["Month"].map({m: i for i, m in enumerate(MONTHS)})
    for c in ["Occupation", "Credit_Mix", "Payment_of_Min_Amount", "Payment_Behaviour"]:
        X[c] = d[c].astype("category").cat.codes
    loans = d["Type_of_Loan"].fillna("")
    for t in ["Auto", "Credit-Builder", "Personal", "Home Equity", "Mortgage", "Student", "Debt Consolidation", "Payday"]:
        X["loan_" + t] = loans.str.contains(t).astype(int)
    return X


X = clean(ALL)
cust = ALL["Customer_ID"]
for c in NUM + ["hist_months"]:                              # robust per-customer value (fixes garbage rows)
    X[c + "_cust_med"] = X.groupby(cust)[c].transform("median")
mix = ALL["Credit_Mix"].replace("_", np.nan)
X["Credit_Mix_cust"] = mix.groupby(cust).transform(lambda s: s.mode().iloc[0] if s.notna().any() else "NA").astype("category").cat.codes


def label_features(known):
    """Labels of the OTHER known rows of the same customer: count per class, mean, nearest month's label."""
    K = pd.DataFrame({"cust": cust.values[known], "m": X["month"].values[known],
                      "y": y.values[known].astype(float), "i": known})
    own = pd.Series(np.nan, index=ALL.index); own.iloc[known] = y.values[known].astype(float)
    F = pd.DataFrame(index=ALL.index)
    F["cust_n"] = cust.map(K.groupby("cust").size()).fillna(0) - own.notna()
    F["cust_mean"] = (cust.map(K.groupby("cust").y.sum()).fillna(0) - own.fillna(0)) / F["cust_n"].replace(0, np.nan)
    for l in [-1, 0, 1]:
        F[f"cust_cnt_{l}"] = cust.map(K[K.y == l].groupby("cust").size()).fillna(0) - (own == l)
    groups = dict(tuple(K.groupby("cust")))
    near, dist = np.full(len(ALL), np.nan), np.full(len(ALL), np.nan)
    for i, (cu, mo) in enumerate(zip(cust.values, X["month"].values)):
        k = groups.get(cu)
        if k is None: continue
        k = k[k.i != i]
        if len(k):
            d = np.abs(k.m.values - mo); j = d.argmin(); near[i], dist[i] = k.y.values[j], d[j]
    F["near_label"], F["near_dist"] = near, dist
    return F


make_model = lambda: HistGradientBoostingClassifier(max_iter=400, learning_rate=0.06, random_state=0)

# ---------------- validation: random 20 % of train rows ----------------
train_idx = np.nonzero(is_train)[0]
perm = np.random.default_rng(0).permutation(train_idx)
hold, fit = perm[: len(perm) // 5], perm[len(perm) // 5:]
XF = pd.concat([X, label_features(fit)], axis=1)
m = make_model().fit(XF.iloc[fit], y.iloc[fit].astype(int))
print(f"holdout accuracy: {accuracy_score(y.iloc[hold].astype(int), m.predict(XF.iloc[hold])):.4f}"
      f"  (majority class {np.mean(y.iloc[hold] == 0):.4f})")

# ---------------- final model: all train rows, label features from all train ----------------
XF = pd.concat([X, label_features(train_idx)], axis=1)
m = make_model().fit(XF.iloc[train_idx], y.iloc[train_idx].astype(int))
test_idx = np.nonzero(~is_train)[0]
pred = m.predict(XF.iloc[test_idx])

rows = [(1, 1, s1), (2, 1, s2), (3, 1, s3), (4, 1, s4)]
rows += [(5, i, int(p)) for i, p in zip(ALL["ID"].values[test_idx], pred)]
pd.DataFrame(rows, columns=["subtaskID", "datapointID", "answer"]).to_csv("final_submission.csv", index=False)
print("wrote final_submission.csv")