The problem in brief
Each Andean textile is known only through a grid of real numbers, a fragment taken from one of its corners. You have to predict its value. The twist is the factory rule: the model must be scikit-learn's LinearRegression with default settings, on at most 100 features, and the whole pipeline (features, training, inference) must run within 60 seconds on a CPU. Supervised models may not be used to build features. Unsupervised methods are allowed. The whole game is therefore feature engineering. You get 40 000 training fragments and 20 000 labelled validation fragments ("live test"), plus 40 000 final-test fragments without labels.
The organisers' final-test values are not published, so every score below is on the official validation set, which we never trained on.
How you are scored
The metric is the root mean square error:
The values are around 1662, with a standard deviation of 97.5, so always predicting the mean gives RMSE 97.5. The organisers publish team points per question on the OPEIA 2025 results page, but no RMSE threshold, so there is no numerical target to compare with.
First look at the data
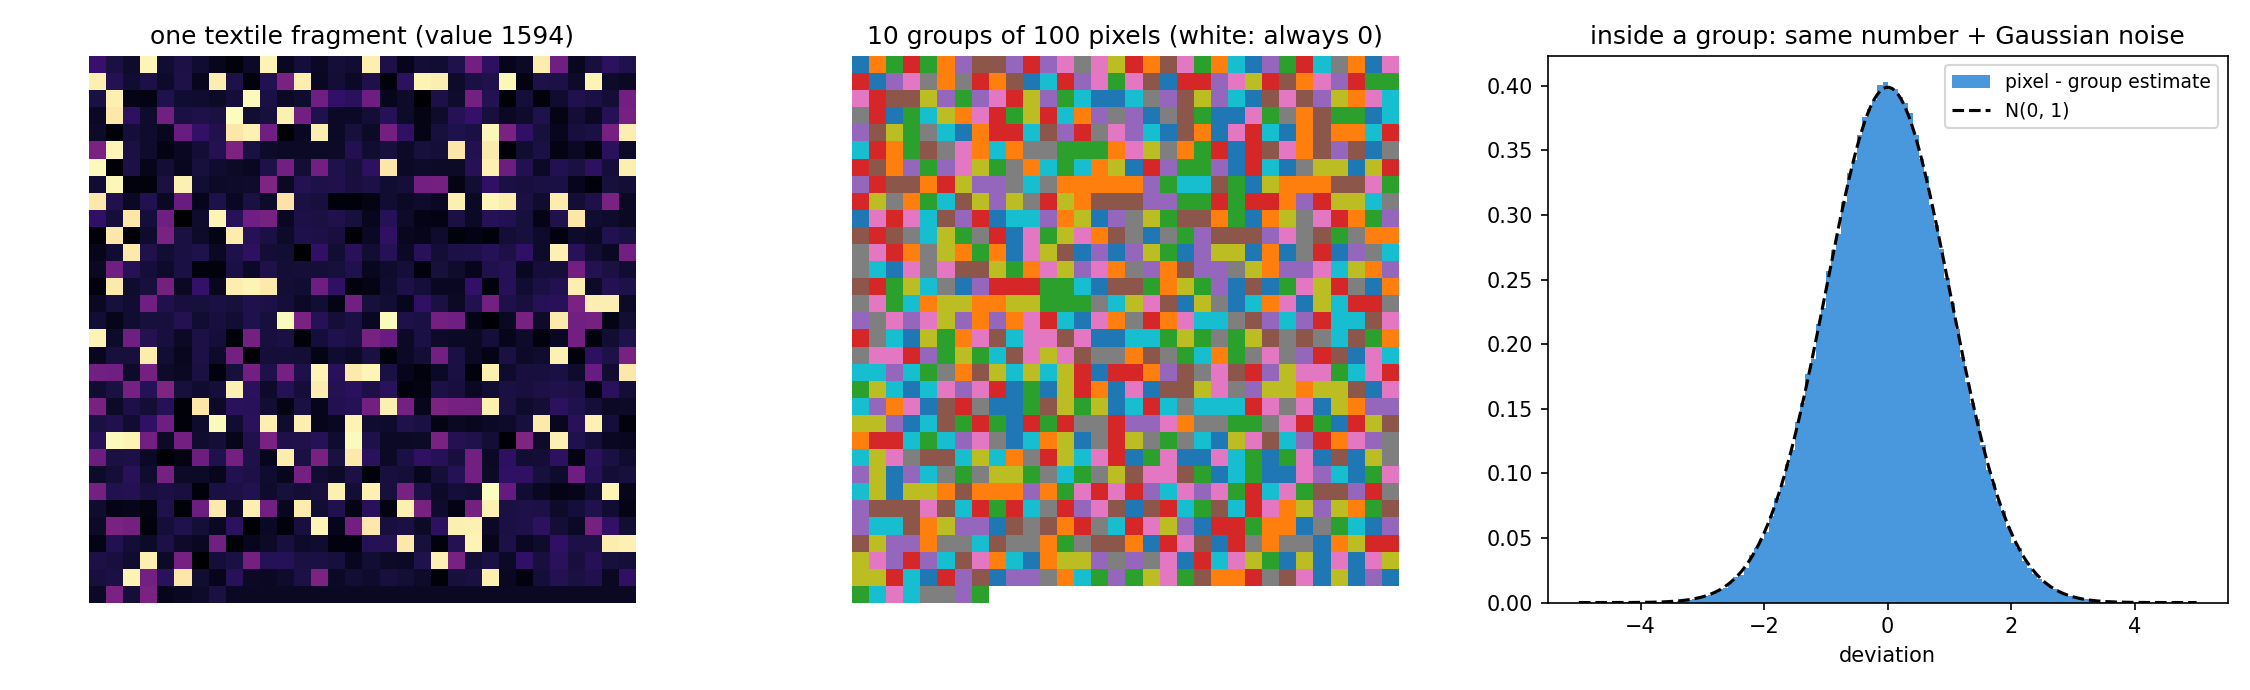
The fragments do not look like textiles at all. Most entries are small numbers (around 0 to 8), some sit near 20, others near 70. A few images contain enormous spikes, as large as . Plotting several fragments side by side shows something more striking: the bright pixels are at the same positions in every image. The layout is fixed, so the pixels play the role of columns in a disguised table.
To find the table's columns without using the labels, compute the correlation between every pair of pixels across 20 000 images (after clipping the spikes) and link pixels whose correlation exceeds 0.3. The connected components are remarkably clean:
- 10 groups of exactly 100 pixels each, scattered over the grid;
- the last 24 pixels of the bottom row are always exactly 0.
Inside a group, all pixels have the same median, and each one deviates from the group value by noise that is exactly : every pixel's noise standard deviation lies between 0.98 and 1.02, and the deviations are uncorrelated between groups. About 1 % of images also carry the huge spikes.
So the generator is: draw 10 hidden numbers (eight are Gaussian; and have skewness 2 and kurtosis 6, the signature of exponential distributions), copy each into 100 pixels, add unit Gaussian noise, sprinkle a few spikes, and shuffle the positions.
A first baseline
The organisers' dummy extractor keeps the first 100 raw pixels. It scores RMSE 181, almost twice as bad as predicting the mean. It sees only a noisy, partial view of a few groups, and the spikes wreck the least-squares fit: a single pixel at 4000 creates an enormous residual.
The key idea
Measure each hidden number as precisely as possible, robustly to outliers, and the linear model does the rest.
If independently, the average of 100 copies has noise standard deviation . That is ten times better than any single pixel. For Gaussian noise the plain mean is the best estimator, but it has no protection against spikes. A single 4000 among 100 pixels shifts the mean by 40, which is why plain group means only reach RMSE 36.8. The median is immune to spikes but less efficient (its variance is times larger for Gaussian noise). The best of both: take the median, reject pixels more than 5 noise-sigmas away from it (a Gaussian pixel never goes that far, a spike always does), and average the rest. This is the maximum-likelihood estimate under the true noise model.
With these 10 robust means, ordinary linear regression already reaches RMSE 5.59. Its coefficients come out as round numbers: about 25, 4, 11, 18, 12, 25, 2, , , 18. Adding all 55 squares and pairwise products and reading their t-statistics on the training set shows that only two nonlinear terms matter: (coefficient 0.98, ) and (coefficient 0.05, ). The other 53 are noise.
How low can you go? Even with perfect modelling, each is known only to within . With coefficients this leaves an unavoidable error
A simulation that treats our estimates as truth and adds fresh 0.1 measurement noise gives 4.75. A pixel-level ridge regression fitted on the residuals finds nothing more (its validation error is worse). The remaining error is the pixel noise itself, and no feature can remove it.
The full solution
- Find the groups (unsupervised). Use the correlation between clipped pixels over 20 000 training images, link pairs with , and take connected components. This gives 10 groups of 100 pixels.
- Denoise each group with the spike-robust mean:
a = X[:, g]                                              # the 100 pixels of one group
ok = np.abs(a - np.median(a, 1, keepdims=True)) < 5      # spikes out, Gaussian noise kept
z = (a * ok).sum(1) / ok.sum(1)
- Features: the 10 centred group means, plus and . That makes 12 features, far below the limit of 100.
- Fit
LinearRegression()on the training set, check it on the validation set, and predict the final test set. The whole pipeline takes 3.6 seconds, well inside the 60-second budget. The final-test fragments have the same layout (identical group means and spreads), so the groups found on the training data transfer.
Results
All RMSEs are on the official validation set of 20 000 fragments.
features for LinearRegression | number | validation RMSE |
|---|---|---|
| predict the training mean | 0 | 97.52 |
| organisers' dummy: first 100 raw pixels | 100 | 181.23 |
| plain mean of each group | 10 | 36.79 |
| median of each group | 10 | 6.62 |
| 10 % trimmed mean of each group | 10 | 5.71 |
| spike-robust mean of each group | 10 | 5.59 |
| trimmed means + all degree-2 terms | 65 | 4.88 |
| spike-robust means + all degree-2 terms | 65 | 4.727 |
| degree-3 polynomial (overfits slightly) | 285 | 4.75 (and over the limit) |
| gradient boosting on the 10 means (not allowed, analysis only) | 7.46 | |
| spike-robust means + + | 12 | 4.727 |
| estimated noise floor | about 4.75 |
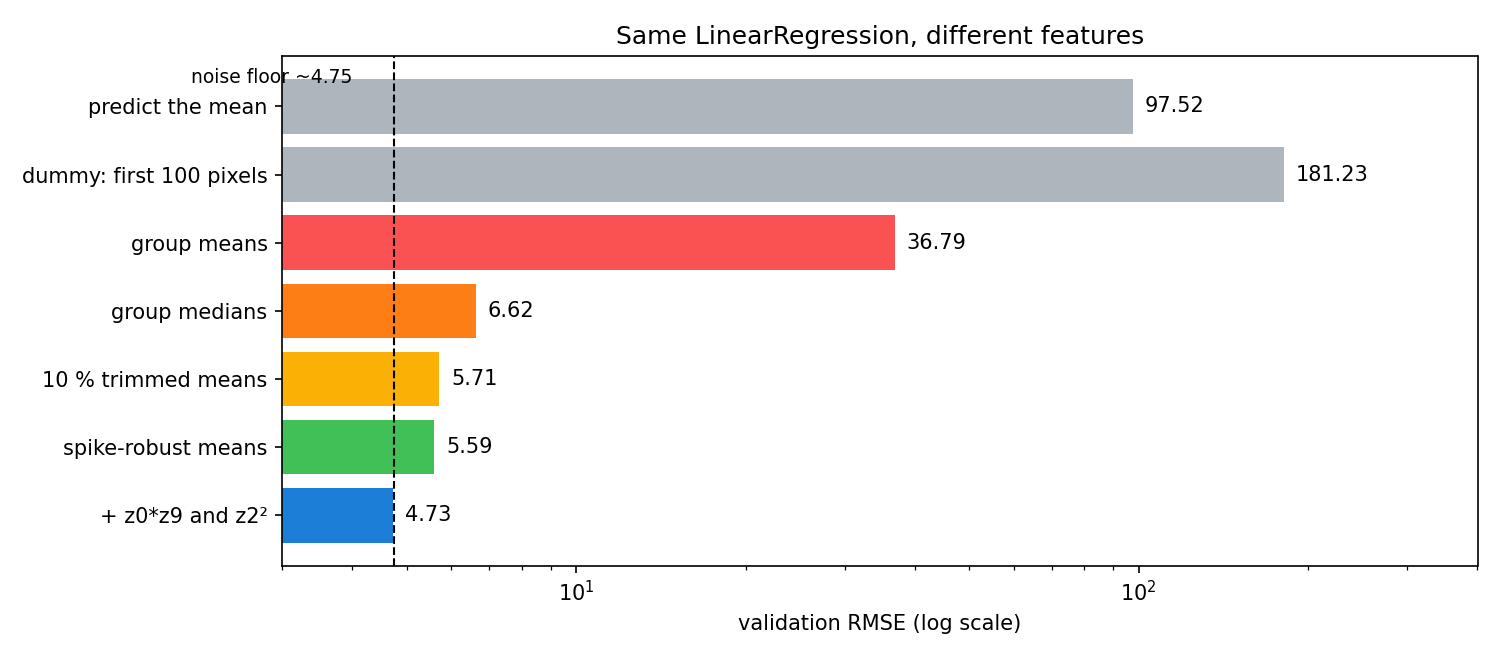
Two results stand out. First, choosing the estimator for each group (mean versus median versus spike-robust mean) moves the RMSE from 37 to 5.6, much more than anything done afterwards. Second, gradient boosting, a far more flexible model, does worse (7.46) than linear regression on the right features: once the features are right, the problem really is linear.
What to remember
- Look for structure before modelling. Correlating pixels across images revealed that 1024 "pixels" were really 10 numbers measured 100 times each. Unsupervised structure discovery is often the strongest feature engineering tool.
- Averaging noisy copies divides the noise by , but only if outliers are handled. Pick the estimator from the noise model: the mean for Gaussian noise, the median against outliers, and a mean with outlier rejection when you have both.
- A linear model is as good as its features. The fit shrinks automatically for measurement noise, and a few product terms capture the interactions. Read t-statistics to keep only the terms that matter.
- Estimate the noise floor. Once your error matches what the measurement noise allows (here 4.73 versus about 4.75), stop: more features or bigger models can only overfit.