The problem in brief
A small inertial sensor (an IMU: a 3-axis accelerometer plus a 3-axis gyroscope) was strapped to people doing yoga poses. Each recording is one repetition of a pose, labelled by an expert as performed correctly (1) or incorrectly (0). You receive these recordings as long tables of sensor readings, one block of rows per repetition id, and must label 23 unseen repetitions. The real difficulty is not the model: it is that there are only 64 labelled repetitions, so every choice (features, validation, which clues to trust) matters.
How you are scored
One label per test id, scored with plain accuracy:
With 23 test items, one mistake costs about 4.3 points of accuracy, so the final score is very noisy. The statement gives no threshold or baseline, and the test labels are private: we evaluate with repeated cross-validation on the 64 training repetitions. The two classes are balanced (33 incorrect, 31 correct), so always answering the same label gives about 52 %.
First look at the data
Three observations before any modelling:
- The sampling rate is not what it seems. The statement says 200 Hz, but 75 % of consecutive rows are exact copies of the previous one: every reading is repeated 4 times. The real rate is 50 Hz. This matters for anything that looks at changes between samples (a derivative computed on the raw rows is zero three times out of four), so we keep one row out of four.
- Each repetition is a short multivariate time series (5 to 36 s, 6 channels). The gravity component dominates the accelerometer (), so the means of tell you the orientation of the sensor, while the gyroscope tells you how fast it rotates.
- Duration is a suspiciously good clue. Incorrect repetitions last about 10 s, correct ones about 16 s: people who do the pose right hold it longer. But the test repetitions are longer still (median 19 s, several above 30 s, longer than anything in training).
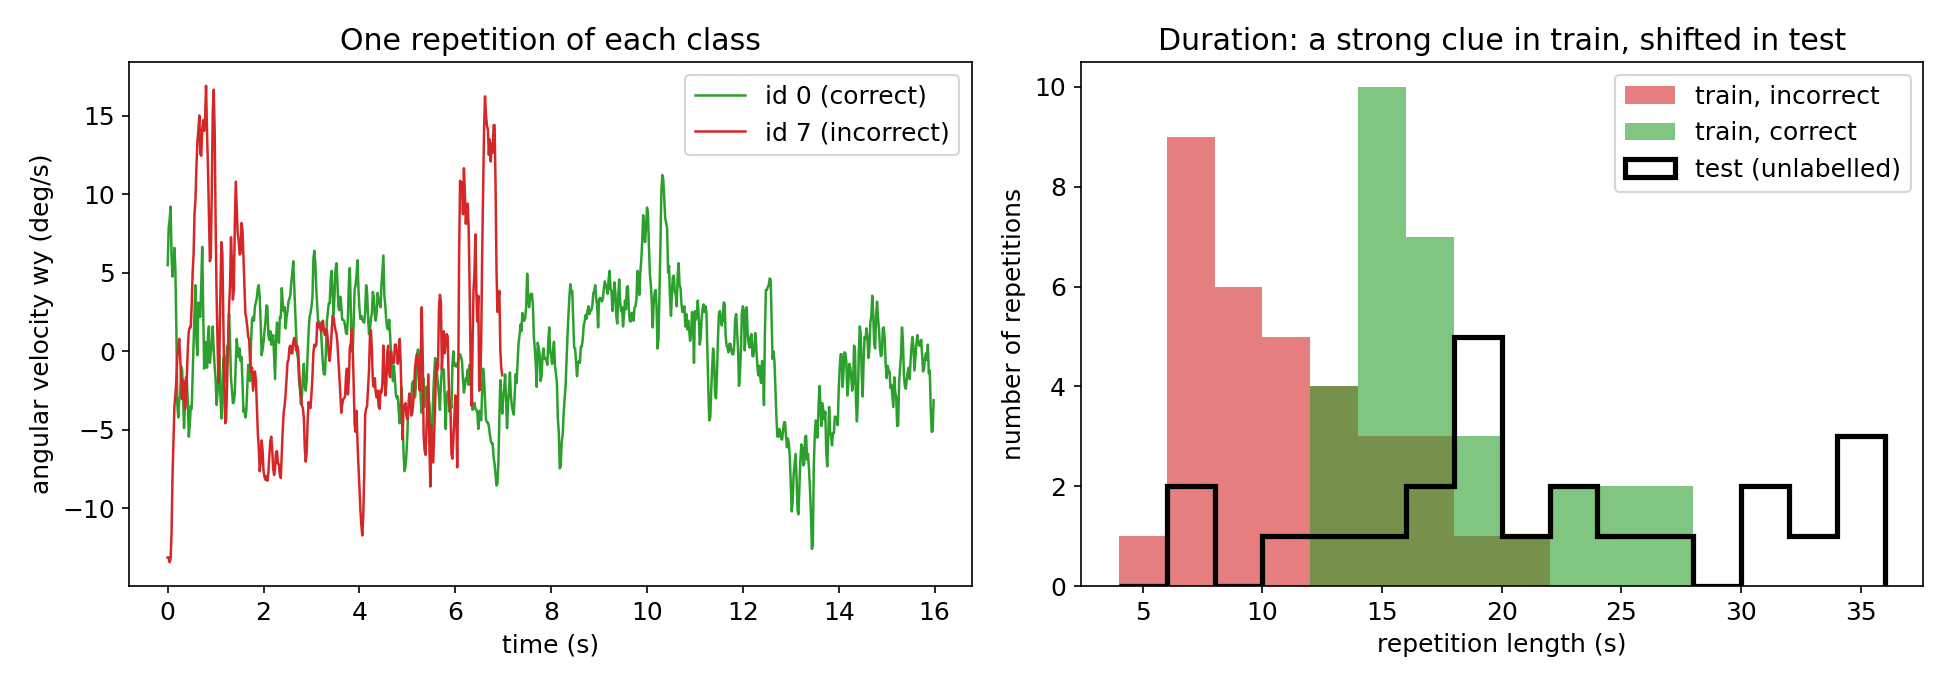
That last point is a warning. A model that leans on duration has learned "long means correct"; on a test set where everything is long, it will predict "correct" almost everywhere, whether or not that is true. We will measure this explicitly.
A first baseline
Since a repetition is a variable-length sequence, the simplest thing that works with 64 examples is to summarise each repetition by a fixed vector of numbers and use a classical classifier. The most naive summary is a single number, the duration:
| approach | CV accuracy |
|---|---|
| always predict "incorrect" | 0.52 |
| duration only, extra trees | 0.77 |
Duration alone already reaches 77 %, which confirms it is informative in training, but it is far from enough and, as argued above, not trustworthy on the test set.
The key idea
What makes a yoga repetition "correct" is how the body moves, and an IMU measures exactly that. Instead of feeding raw sequences to a deep network (hopeless with 64 examples), we translate coaching intuitions into statistics computed per channel:
- posture: mean of each axis, and its mean over the first, middle and last fifth of the repetition (where the body is at the start, during the hold, at the end);
- range of motion: standard deviation, 5 % and 95 % quantiles and peak-to-peak range of each axis;
- smoothness: the standard deviation of successive differences (a discrete "jerk"). A controlled movement changes gradually; a wobbly or rushed one has large sample-to-sample jumps, like the red spikes in the figure above;
- overall activity: mean and 95 % quantile of the gyroscope norm , standard deviation of the acceleration norm.
That is 58 numbers per repetition. Crucially, none of them grows with the length of the recording: a mean, a quantile or a standard deviation of a 30 s hold is on the same scale as for a 15 s hold. (A total such as "accumulated rotation" would scale with length, and it was in fact the top feature of a first random forest: a hidden copy of the duration. We dropped it.)
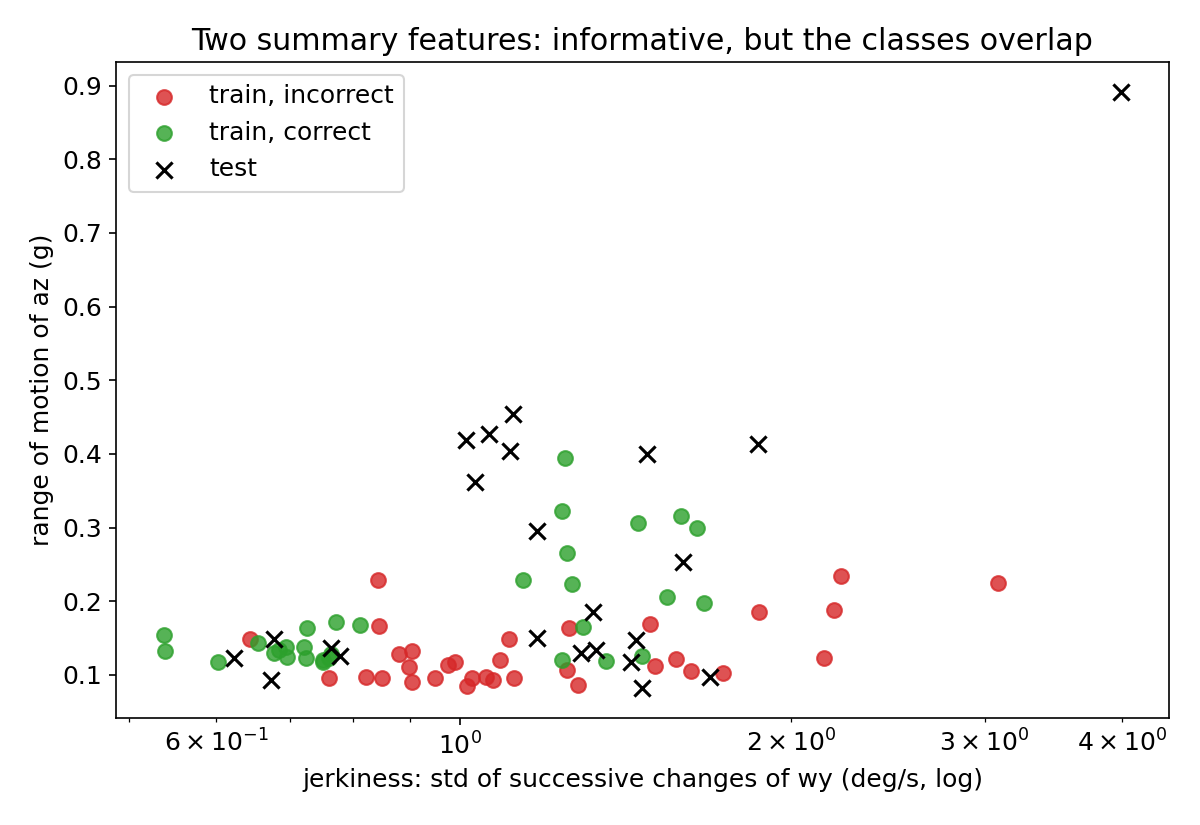
No pair of features separates the classes on its own, as the plot shows. This is where the model comes in: an ensemble of randomised trees (extra trees) combines dozens of weak, partly redundant clues. Why extra trees rather than logistic regression? With 64 examples and 58 features, a linear model has to fight the dimension (it got 86 % here), whereas trees pick features one threshold at a time, ignore useless ones, and do not care that features live on very different scales (degrees per second versus ). Averaging 500 trees grown with random thresholds keeps the variance low, which is exactly what a tiny dataset needs.
Validating honestly with 64 examples. A single 80/20 split would score the model on 13 repetitions: one lucky split can swing the estimate by 15 points. We use stratified 8-fold cross-validation repeated 10 times with different shuffles (80 fits) and report the mean and standard deviation of the 80 fold accuracies.
The full solution
- Load the three CSVs, rename the columns, and keep one row out of four (true 50 Hz signal).
- For each
id, compute the 58 length-invariant features listed above:
a = g[COLS].values[::4]            # de-duplicated signal of one repetition
for j, c in enumerate(COLS):
    s, d = a[:, j], np.diff(a[:, j])
    f[c + "_std"] = s.std()        # amount of movement
    f[c + "_range"] = np.ptp(s)    # range of motion
    f[c + "_jerk"] = d.std()       # smoothness
    f[c + "_mid"] = s[2*n//5: 3*n//5].mean()   # posture during the hold
- Compare feature sets with repeated stratified 8-fold CV, using
ExtraTreesClassifier(n_estimators=500). - Fit on all 64 repetitions with the length-invariant features and write
solution.csv(id,label, ids in increasing order).
The final model labels 20 of the 23 test repetitions as correct. That is a much higher rate than in training (48 %), but the test repetitions are also much longer, and long holds were mostly correct in training: two independent signals (the duration we refused to use and the movement features we did use) point the same way, which is reassuring.
Results
Cross-validated accuracy on the 64 training repetitions (8 folds x 10 repeats; official test labels are private):
| approach | CV accuracy |
|---|---|
| majority class | 0.52 |
| duration only (extra trees) | 0.77 0.15 |
| two hand-picked features (extra trees) | 0.78 |
| 58 features, logistic regression | 0.86 |
| all features incl. duration and total rotation, random forest | 0.93 |
| all features incl. duration, extra trees | 0.96 0.07 |
| length-invariant features, extra trees (final) | 0.94 0.08 |
The final choice is deliberately not the best line of the table. Adding duration gains 1.7 points in cross-validation, roughly one repetition out of 64, which is well within the noise, and it buys that point with a feature whose distribution clearly shifts on the test set. Giving up a tiny, uncertain gain to avoid a known risk is the right trade.
What to remember
- Look at the raw rows. Spotting that every sample is repeated 4 times changes the meaning of every derivative-based feature; nobody tells you this.
- Variable-length time series plus a tiny dataset: summarise, then use trees. Means, quantiles, ranges and "jerk" statistics per channel turn sequences into a table where classical models shine.
- Compare train and test distributions of your strongest features. A feature that is a shortcut in training (here duration, and its hidden copy "total rotation") can betray you when the test set is shifted.
- With few examples, use repeated cross-validation and read the standard deviation. A difference of 1 to 2 points between models is noise when the standard deviation is 7 points.