The problem in brief
Ten students each say how many pets they own, giving the list . You must summarise this list with three classic "typical value" statistics: the arithmetic mean, the mode and the median. It is the warm-up task of the Fizmat AI Olympiad 2025 (Kazakhstan) online selection, so the computation itself is short. The interesting part is understanding why there are three different answers to "what is a typical value?", and why machine learning cares about all three.
How you are scored
The answer is a single line with three numbers separated by spaces: mean, then mode, then median. A fully correct line earns 10 points; this is an exact-answer task, there is no partial metric.
Our answer, checked three independent ways in Python (exact fractions, the statistics module and NumPy):
First look at the data
Before computing anything, draw the data. Each dot below is one student.
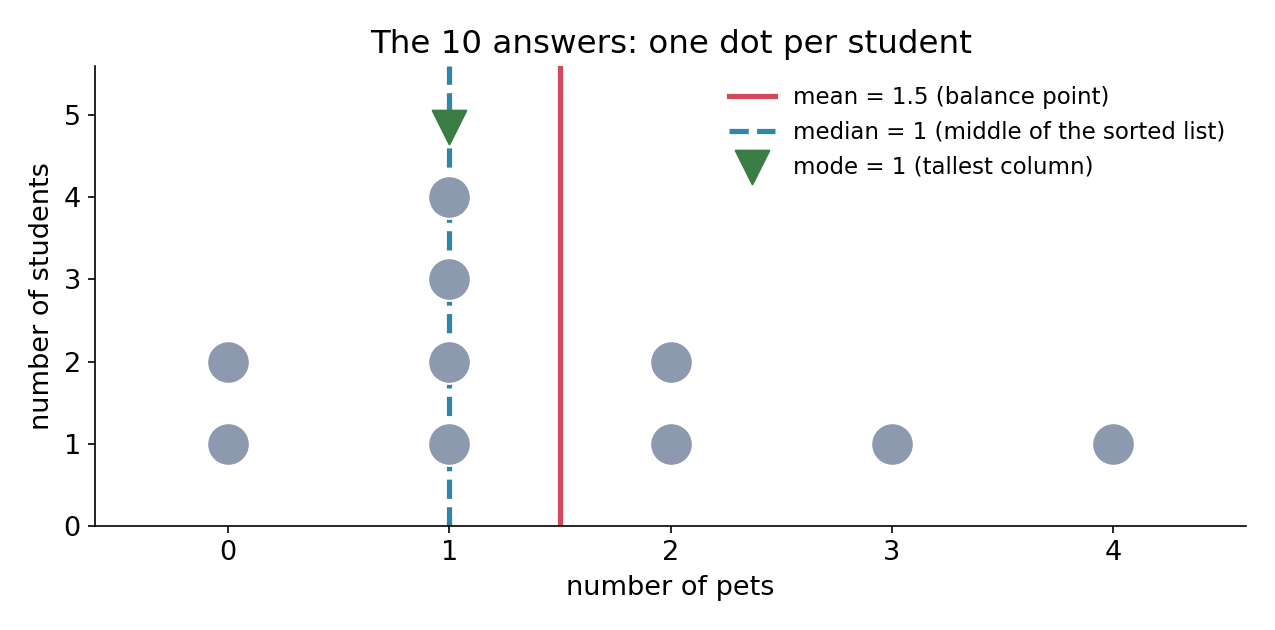
Three things jump out:
- The values pile up on the left (0, 1, 2) and a thin tail stretches to the right (3 and 4). Such a distribution is called right-skewed.
- The tallest column is at 1: that will be the mode.
- The tail pulls the mean to the right of the bulk of the data, so we should expect mean median. A picture lets you predict the order of the answers before doing any arithmetic, which is an excellent sanity check.
The frequency table makes everything else easy:
| pets | 0 | 1 | 2 | 3 | 4 | total |
|---|---|---|---|---|---|---|
| students with pets | 2 | 4 | 2 | 1 | 1 | 10 |
Question by question
1. The mean
The mean is the sum of the values divided by how many there are:
With the frequency table the sum is quicker: .
A mean of 1.5 pets is not a value any student can have. That is normal: the mean is a balance point, not an observed value. If you put the ten dots on a weightless ruler, it balances exactly at 1.5, because the deviations on each side cancel:
Classic trap: the two students with zero pets still count. Dividing by the 8 pet owners gives , which answers a different question ("how many pets does a pet owner have on average?").
Answer: 1.5.
2. The mode
The mode is the value that appears most often. From the table, 1 appears four times and no other value appears more than twice, so the mode is unique.
Answer: 1. Note that the mode is the value 1, not its frequency 4: confusing the two is the most common slip on this question.
(A list can have several modes when there is a tie for the top frequency, for example . Here there is no tie, so the answer is unambiguous.)
3. The median
First sort the list, the step people most often forget:
With (even) there is no single middle element, so the median is the average of the two central ones, positions and :
(For odd it would simply be the element at position .)
Answer: 1.
A subtle point worth noticing: the statement's informal definition says "50 % of the values are smaller and 50 % are larger". With ties this cannot hold literally: here only 2 values are below 1, 4 are equal to 1 and 4 are above. The precise version is: at least half of the values are the median and at least half are it. Check: 6 of 10 values are , 8 of 10 are .
The key idea
Why do statisticians and ML practitioners keep three different "centres"? Because each one is the best single guess for a different way of measuring error. Imagine you must predict every student's number of pets with one constant . How good is depends on how you are penalised:
| loss for one student | total loss | best constant |
|---|---|---|
| squared error | the mean | |
| absolute error | the median | |
| 0-1 error: 1 if , else 0 | the mode |
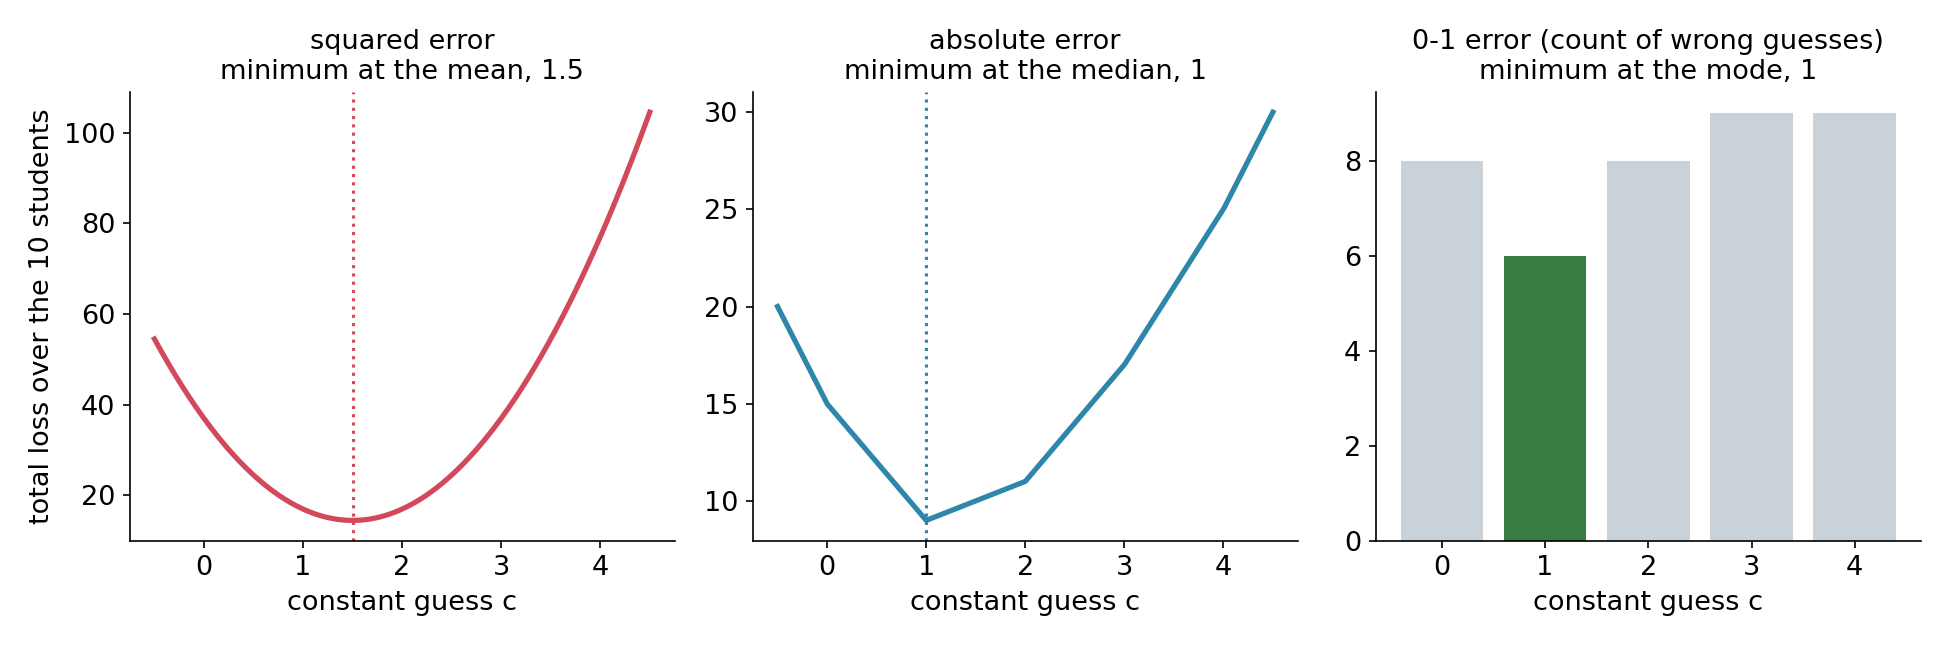
Here is why each line of the table is true.
Squared error gives the mean. is a parabola in . Setting its derivative to zero,
On our data the minimum value is .
Absolute error gives the median. is a broken line. Each point to the left of adds to the slope, each point to the right adds , so
Just below the slope is (going down), just above it is (going up). The function turns around exactly at 1: the median, where the points on each side "balance in number" rather than in distance. Minimum value: .
0-1 error gives the mode. You are wrong for every student whose value differs from , so you want the shared by the most students: 1 (wrong 6 times, against 8 or 9 times for any other choice).
This explains the examples in the statement. Training a regressor with MSE pushes it toward conditional means; training with MAE pushes it toward conditional medians; a classifier that maximises accuracy, or an ensemble deciding by majority vote, outputs the mode of its votes.
It also explains robustness. Suppose the student with 4 pets had typed 40 by mistake. The squared loss punishes that single point enormously, so the mean jumps from 1.5 to 5.1. The absolute loss only counts which side each point is on, so the median stays at 1, and so does the mode. That is why salaries and house prices are usually reported with medians, and why MAE is preferred over MSE when the data contain outliers.
The full solution
The whole task fits in a few lines; the point of solution.py is to check each answer independently rather than trust one computation:
from fractions import Fraction
from collections import Counter
import statistics, numpy as np

pets = [2, 0, 1, 3, 2, 1, 0, 4, 1, 1]
mean = Fraction(sum(pets), len(pets))             # exact: 3/2
counts = Counter(pets)                            # {1: 4, 0: 2, 2: 2, 3: 1, 4: 1}
modes = [v for v, k in counts.items() if k == max(counts.values())]
s = sorted(pets); n = len(s)
median = (s[n//2 - 1] + s[n//2]) / 2              # n even: average the middle two

assert mean == statistics.mean(pets) == np.mean(pets) == 1.5
assert modes == statistics.multimode(pets) == [1]
assert median == statistics.median(pets) == np.median(pets) == 1
print(f"{float(mean):g} {modes[0]} {median:g}")   # 1.5 1 1
The script also verifies the key idea by brute force: it evaluates the squared and absolute losses on a grid of 50 001 constants between and and finds their minima at and , and computes the 0-1 loss for each integer value (8, 6, 8, 9, 9 errors for ).
Final line to submit:
1.5 1 1
Results
| approach | mean | mode | median | verdict |
|---|---|---|---|---|
correct computation (hand, statistics, NumPy agree) | 1.5 | 1 | 1 | correct, 10 points |
| divide by pet owners only (forget the zeros) | 1.875 | 1 | 1 | wrong mean |
| report the frequency of the mode instead of the mode | 1.5 | 4 | 1 | wrong mode |
| take the median of the unsorted list (5th and 6th entries: 2 and 1) | 1.5 | 1 | 1.5 | wrong median |
| take only the 5th sorted value, or only the 6th | 1.5 | 1 | 1 | right here by luck (both are 1), wrong in general |
| robustness check: the "4" replaced by an outlier "40" | 5.1 | 1 | 1 | mean moves a lot, median and mode do not |
What to remember
- Look before you compute. A dot plot or frequency table predicts the shape (here right-skewed, so mean median) and catches arithmetic slips.
- Mean, median and mode are the best constant predictions under squared, absolute and 0-1 loss respectively. Choosing a loss function is choosing which "centre" your model aims for.
- The mean is sensitive to outliers, the median and mode are not. Prefer the median (and MAE) when a few extreme values could dominate.
- Mechanics matter: sort before taking a median, average the two middle values when is even, and keep zero values in the count.
- Verify a hand answer with an independent computation (here exact fractions plus two libraries): it costs seconds and is the habit that saves points in every later, harder problem.