← Back to the problem

Kazakhstan FAIO 2024 · Correction by IOAI Training

B. The Story of a Meteorologist

This page gives the full approach. Read it once you have searched.

Metric
exact output on hidden tests
Evaluated on
self-generated tests (official tests are hidden)
Our score
sample exact, self-tests pass
Expected level
sample output (13 outliers)

Expected level reached

We solved the problem ourselves: downloaded the data, ran the experiments and measured the score below. The statement and data belong to their organisers.

The problem in brief

A meteorologist's year of ice-purity measurements has been polluted: his intern sometimes faked readings with ice from his own fridge. You receive the measurements on one line and must print the suspicious ones, using the interquartile range rule: any value below Q1−1.5 IQRQ_1 - 1.5\,\text{IQR} or above Q3+1.5 IQRQ_3 + 1.5\,\text{IQR} is an outlier. The program reads standard input and writes the outliers on one line. The sample has 1000 values and 13 outliers.

How you are scored

A hidden set of tests on the Yandex judge compares your output line with the expected one. The tests are not public, so we validate on the statement's sample (reproduced exactly) and on self-made tests. Two details decide whether you pass: which quartile definition you use and how you print the values.

The key idea

Quartiles and IQR are robust statistics. The mean and the standard deviation are dragged around by the very outliers you are looking for: one value at −106-10^6 moves the mean and inflates the standard deviation so much that nothing looks unusual any more (this is why the z-score method in the statement needs roughly normal, clean data). Quartiles, in contrast, depend only on the ranks of the middle of the data. You can make the 13 outliers as extreme as you like, Q1Q_1 and Q3Q_3 will not move. That is what makes the fences

L=Q1−1.5 (Q3−Q1),U=Q3+1.5 (Q3−Q1)L = Q_1 - 1.5\,(Q_3 - Q_1), \qquad U = Q_3 + 1.5\,(Q_3 - Q_1)

trustworthy. For normally distributed data, IQR≈1.35σ\text{IQR} \approx 1.35\sigma, so the fences sit at about μ±2.7σ\mu \pm 2.7\sigma, and only 0.7 % of clean points fall outside them.
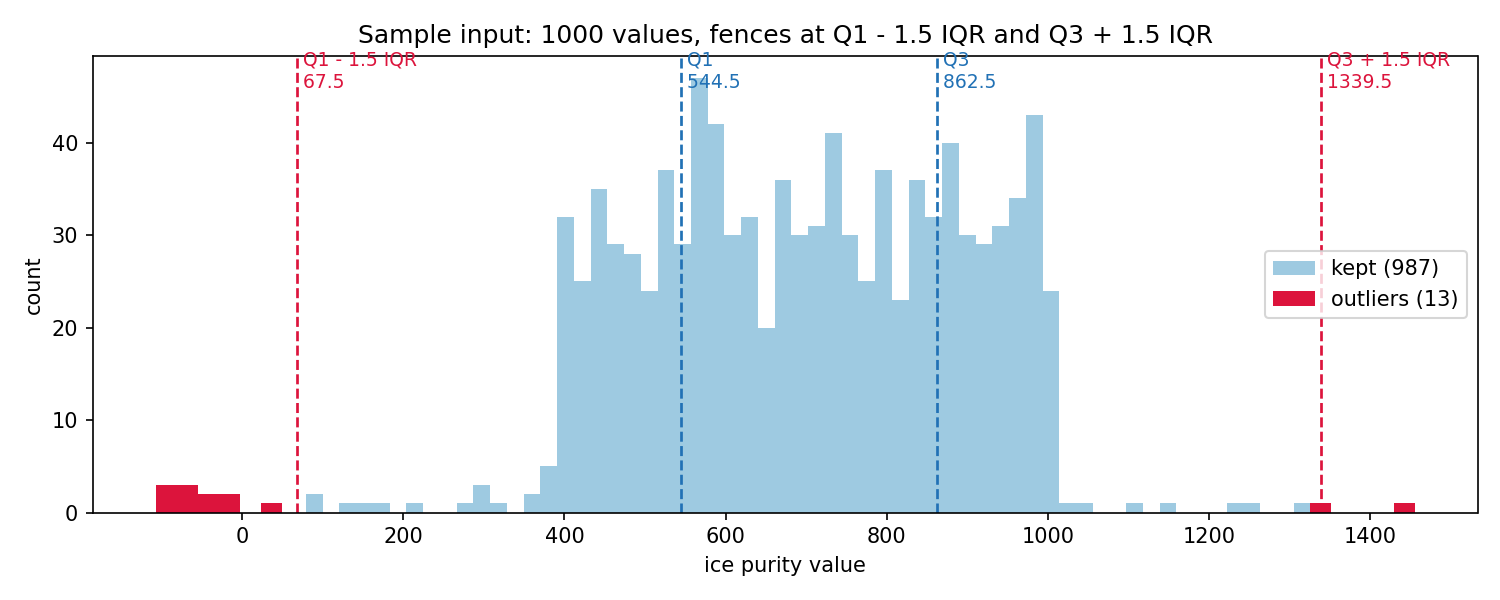
The sample: 1000 values, the quartiles and the two fences

On the sample, Q1=544.53Q_1 = 544.53, Q3=862.52Q_3 = 862.52, IQR=317.99\text{IQR} = 317.99, so L=67.54L = 67.54 and U=1339.51U = 1339.51. The ten negative purities and 27.256 fall below LL; 1348.399 and 1455.191 lie above UU. Notice that 1325.914 and 79.269 are close but inside: the fences are strict.

Which quartile?

There is no single definition of a quartile for a finite list. Two common ones:

  • Linear interpolation (numpy's default, Excel's PERCENTILE.INC): sort the nn values as x(0)≤⋯≤x(n−1)x_{(0)} \le \dots \le x_{(n-1)}, the pp-quantile sits at position p(n−1)p(n-1), interpolated between the two neighbouring order statistics.
  • Tukey's hinges, which match the statement's wording ("the middle of the lower half"): Q1Q_1 is the median of the lower half, Q3Q_3 the median of the upper half.

On the sample both give the same 13 outliers (the quartiles differ only in the second decimal). On random inputs with a few outliers they disagree in 6 to 12 % of cases, almost always on a value sitting right at a fence. We use linear interpolation, which is what nearly every contestant (and very likely the reference solution) gets from np.percentile or pandas.quantile. Be aware that this is a guess about a hidden test set: if your solution fails on a borderline test, the definition is the first thing to switch.

The full solution

tokens = sys.stdin.read().split()
values = [float(t) for t in tokens]
s = sorted(values)
q1, q3 = percentile(s, 0.25), percentile(s, 0.75)     # linear interpolation
iqr = q3 - q1
lo, hi = q1 - 1.5 * iqr, q3 + 1.5 * iqr
print(" ".join(t for t, v in zip(tokens, values) if v < lo or v > hi))

Three details matter:

  1. Keep the input order: the expected output lists 1455.191 first, then the negative values, in the order they were read, not sorted.
  2. Print the original strings, not re-formatted floats. Printing f"{v:g}" would turn 1455.191 into 1455.19 and fail; printing the token you read is always exact.
  3. Strict inequalities: values exactly on a fence are not outliers ("outside the range").

The whole program is O(nlog⁡n)O(n \log n) because of the sort, instant for any realistic nn.

Results

checkresult
statement sample (1000 values, 13 outliers)identical output
our percentile against np.percentile on 2000 random listsidentical to 10−910^{-9}
hand-made edge cases (all equal values, IQR = 0, negative and scientific notation)pass
linear vs Tukey quartiles, random inputs, n=10n = 10 / 100100 / 10001000differ on 12.3 % / 8.7 % / 6.5 %
printing re-formatted floats (%g) instead of the tokensfails the sample

What to remember

  • Detect outliers with robust statistics (median, quartiles, IQR, MAD): the mean and standard deviation are distorted by the very points you want to find.
  • The 1.5 IQR rule is about ±2.7σ\pm 2.7\sigma for normal data; it is the rule behind the whiskers of a box plot.
  • Quantile definitions differ on finite samples: know which one your library uses, and expect them to matter only on borderline cases.
  • In judged programs, output formatting is part of the answer: keep the input order and echo the original tokens.
Full code (solution.py)
"""FAIO 2024, problem B: The Story of a Meteorologist -- IQR outlier detection.

stdin : one line of N real numbers
stdout: the outliers (outside [Q1 - 1.5 IQR, Q3 + 1.5 IQR]) in input order, printed exactly as given

Quartiles: linear-interpolation percentiles (numpy's default, Excel's PERCENTILE.INC). The
statement's "middle of each half" (Tukey hinges) gives the same answer on the sample; see
--check, which also measures how often the two definitions disagree.

Run:  python solution.py < input.txt
      python solution.py --check            (self-tests + definition comparison)
      python solution.py --figure sample.in (draws figures/fences.png)
"""
import sys


def percentile(sorted_x, p):
    """Linear interpolation between order statistics: position p*(n-1) in the sorted list."""
    pos = p * (len(sorted_x) - 1)
    lo = int(pos)
    hi = min(lo + 1, len(sorted_x) - 1)
    return sorted_x[lo] + (sorted_x[hi] - sorted_x[lo]) * (pos - lo)


def median(v):
    n = len(v)
    return v[n // 2] if n % 2 else (v[n // 2 - 1] + v[n // 2]) / 2


def fences(values, method="linear"):
    s = sorted(values)
    if method == "linear":
        q1, q3 = percentile(s, 0.25), percentile(s, 0.75)
    else:                                   # Tukey hinges: medians of the lower / upper halves
        n = len(s)
        q1, q3 = median(s[: n // 2]), median(s[(n + 1) // 2:])
    iqr = q3 - q1
    return q1 - 1.5 * iqr, q3 + 1.5 * iqr


def outliers(tokens, method="linear"):
    values = [float(t) for t in tokens]
    lo, hi = fences(values, method)
    return [t for t, v in zip(tokens, values) if v < lo or v > hi]


def solve():
    tokens = sys.stdin.read().split()
    if tokens:
        print(" ".join(outliers(tokens)))
    else:
        print()


def check():
    import random
    import numpy as np
    rng = random.Random(0)
    # 1. our percentile == numpy's default
    for _ in range(2000):
        x = [rng.gauss(0, 1) for _ in range(rng.randint(1, 60))]
        s = sorted(x)
        assert abs(percentile(s, 0.25) - np.percentile(x, 25)) < 1e-9
        assert abs(percentile(s, 0.75) - np.percentile(x, 75)) < 1e-9
    # 2. hand-made cases
    assert outliers("1 2 3 4 100".split()) == ["100"]
    assert outliers("5 5 5 5".split()) == []                  # IQR = 0, nothing strictly outside
    assert outliers("5 5 5 5 6".split()) == ["6"]             # IQR = 0, anything different is out
    assert outliers("-3 1 2 3 4".split()) == ["-3"]
    assert outliers("1.50 2 3 4 1e3".split()) == ["1e3"]      # printed exactly as read
    print("self-tests OK")
    # 3. how often do the two quartile definitions give a different outlier list?
    for n in (10, 30, 100, 1000):
        diff = 0
        for _ in range(2000):
            x = [f"{rng.gauss(650, 200) if rng.random() > 0.02 else rng.uniform(-100, 1500):.3f}"
                 for _ in range(n)]
            diff += outliers(x, "linear") != outliers(x, "tukey")
        print(f"n={n:5d}: definitions disagree on {100 * diff / 2000:.1f} % of random inputs")


def figure(path):
    import matplotlib
    matplotlib.use("Agg")
    import matplotlib.pyplot as plt
    import numpy as np
    tokens = open(path).read().split()
    x = np.array([float(t) for t in tokens])
    lo, hi = fences(list(x))
    q1, q3 = np.percentile(x, [25, 75])
    out = (x < lo) | (x > hi)
    fig, ax = plt.subplots(figsize=(10, 4))
    ax.hist(x[~out], bins=60, color="#9ecae1", label=f"kept ({(~out).sum()})")
    ax.hist(x[out], bins=60, range=(x.min(), x.max()), color="crimson", label=f"outliers ({out.sum()})")
    for v, nm, c in [(q1, "Q1", "#2171b5"), (q3, "Q3", "#2171b5"), (lo, "Q1 - 1.5 IQR", "crimson"),
                     (hi, "Q3 + 1.5 IQR", "crimson")]:
        ax.axvline(v, color=c, ls="--", lw=1.3)
        ax.text(v, ax.get_ylim()[1] * 0.93, f" {nm}\n {v:.1f}", color=c, fontsize=9)
    ax.set_xlabel("ice purity value"); ax.set_ylabel("count")
    ax.set_title("Sample input: 1000 values, fences at Q1 - 1.5 IQR and Q3 + 1.5 IQR")
    ax.legend(loc="center right")
    fig.tight_layout(); fig.savefig("figures/fences.png", dpi=150, facecolor="white")


if __name__ == "__main__":
    if "--check" in sys.argv:
        check()
    elif "--figure" in sys.argv:
        figure(sys.argv[-1])
    else:
        solve()