The problem in brief
Each problem is a picture of a polynomial drawn on a coordinate grid, with a few marked points such as roots, the -intercept or one extra point, plus one sentence of text: "A cubic has zeros at , and . The -intercept is visible in the graph. Find ." You must write a local program (no LLM or API calls) that returns the numeric answer. It must also say INCOMPLETE when the picture and the text do not pin the answer down, and CONFLICT when they contradict each other. You get 80 training problems with answers and 50 test problems without. Part Q1 also asks you to sort the problem bank into clusters and to explain how you recognise the two special cases.
The notebook's download server is dead, but the organisers' public Drive folder still holds both CSV files and all 130 images. The test answers are private, so our only exact score is on the 80 training problems. We back it up with an independent consistency check on the test set, described below.
How you are scored
A prediction counts as correct if it is within of the true number, or if it matches INCOMPLETE / CONFLICT exactly. The score is the percentage of correct test problems:
Performance is worth 6 of the 30 points. The rest goes to the write-up (clusters, special cases, approach) and to the code. The organisers publish no accuracy threshold.
First look at the data
Reading the 80 questions, they fall into a handful of templates. Parsing the text puts each problem in one cluster, and the counts are:
| cluster | example | train count |
|---|---|---|
| roots in the text, scale in the picture, find a value or a coefficient | "zeros at 1 and 3, use the -intercept, evaluate " | 41 (3 of them INCOMPLETE) |
| leading coefficient in the text, zeros only on the picture, find | "leading coefficient , its zeros are labelled" | 7 (all CONFLICT) |
| parabola meets a line, find the other crossing | " has leading coefficient , -intercept , " | 10 |
| one root hidden as '?' | "leading coefficient 2, zeros at and , third zero marked '?'" | 8 |
| roots and | ", find the positive " | 8 |
| roots in arithmetic progression | "roots , , , find " | 6 |
Every case reduces to the same object: , where some of , the , or the '?' root are unknown. The marked points, and the curve itself, add equations.
The pictures come in two plotting styles. Most use mathtext labels such as , axes through the origin and labelled ticks. A second style, slightly squarer (about 700 by 697 pixels), has plain labels such as (0,-14). Here is a striking leak: all 10 INCOMPLETE/CONFLICT training problems, and only those, use the second style. A "lazy" classifier on image size would get the special cases right for free. We do not use this, because it explains nothing and would collapse on any new generator. It is still worth noting in Q1, since it tells you the organisers built the special cases with a separate script.
What makes a problem INCOMPLETE? The unknown that the question asks about is not fixed by anything. In the three training cases, the question asks for the leading coefficient of a curve whose only labelled points are its roots, and the picture has no tick labels (see train_078). Every multiple goes through the same roots, so can be anything.
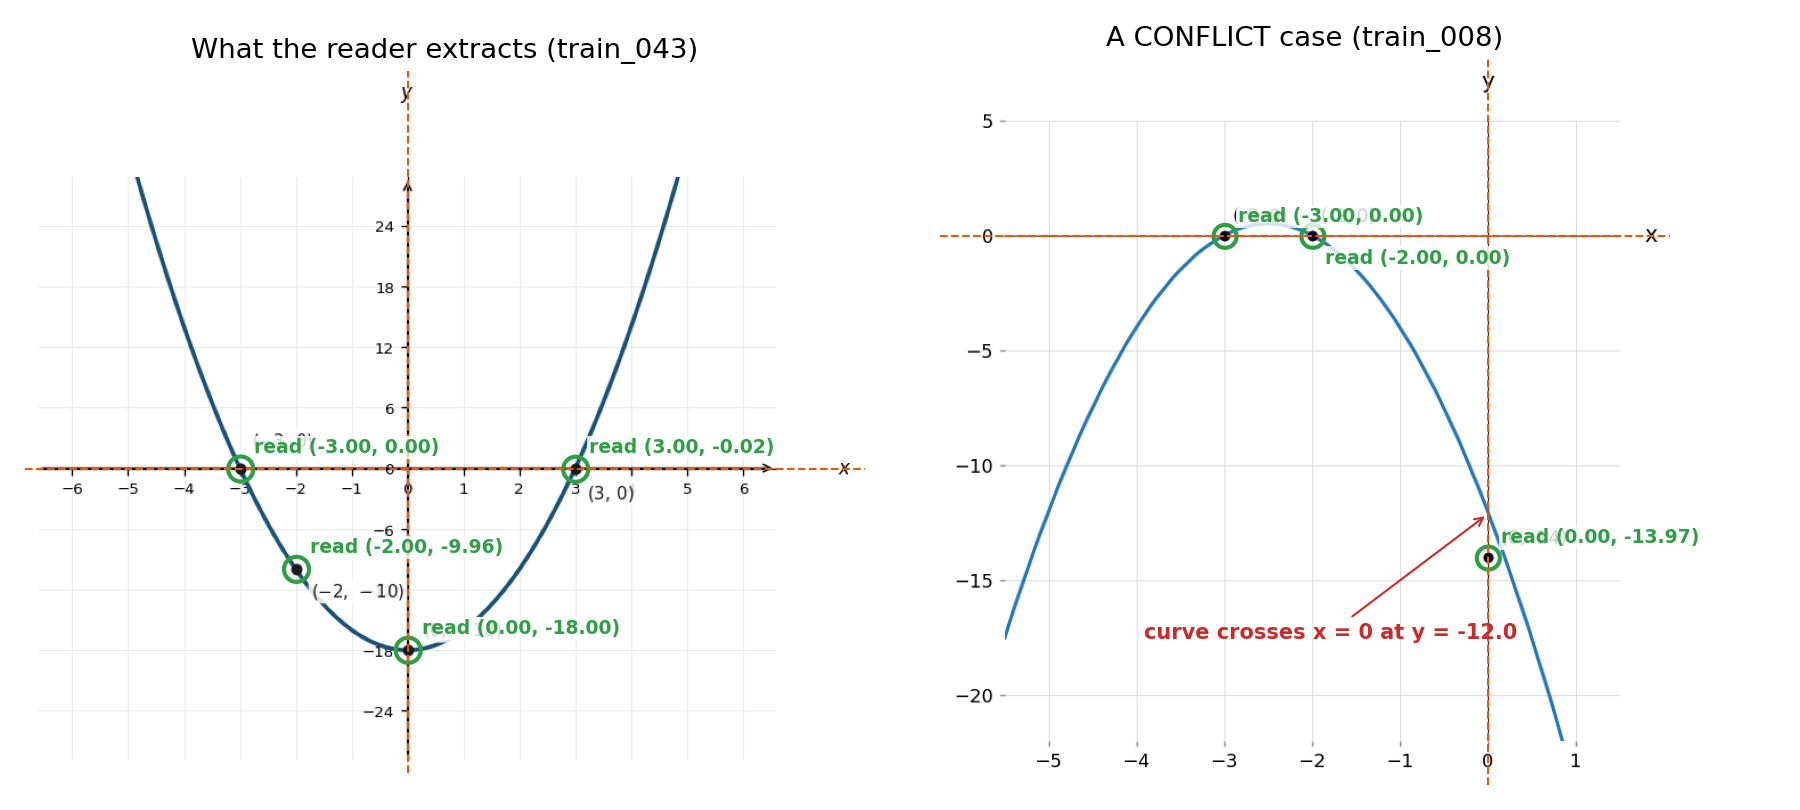
What makes a problem a CONFLICT? There are more equations than unknowns, and they disagree. In train_008, the text says leading coefficient and the picture shows roots and , so . The picture, however, labels the -intercept as , and that dot is visibly off the drawn curve, which does pass through .
A first baseline
Text only. If we solve from the sentence alone, ignoring the picture, we only get the problems that need no scale: the three INCOMPLETE ones, plus the symmetric-roots case of train_007. There, the coefficient of for roots is , whatever is. That gives 4 / 80 (5 %). The picture carries almost all of the information.
OCR of the labels. The obvious next step is to OCR every "(x, y)" label with a small local OCR model (RapidOCR, an ONNX model installed with pip) and plug the numbers into the algebra. That gives 60 / 80 (75 %). The failures teach something. The OCR drops minus signs (it reads as "(-1,2 8)" and as "12"), it merges labels that the curve crosses, and some problems have no scale label at all.
The key idea
Do not read the numbers; measure the picture. A plot is a linear map between pixels and data:
where are pixel coordinates. If we recover this map, every marked dot gives its coordinates by pure geometry, and labels become a mere cross-check. The map is fixed by structure that is far more reliable than OCR:
- the axis lines are the longest dark rows and columns, which gives and to the pixel;
- the light grid lines give the pixel length of one tick step. We choose the unit (0.5, 1 or 2) that makes the root dots agree with the roots quoted in the text;
- for the scale we use the tick labels, but only their magnitudes , combined by a median. The OCR loses signs and sometimes reads "9-" for , and the median of magnitudes is immune to both.
Dots are found by morphological opening with a 7-pixel disk on the dark (or red) pixels. Text strokes and axis lines are 1 to 2 pixels thick and disappear, while the filled markers survive. Black dots are known points. Red dots are the unknowns (the '?' root, "", the other crossing). With this reader, the dot coordinates agree with the readable labels 205 times out of 212, and the 7 disagreements are all OCR mistakes, not geometry mistakes.
Then solve exactly, and let the solver decide INCOMPLETE and CONFLICT. Each black dot off the axis adds an equation . Sympy solves the system with rational arithmetic, which turns the two special labels into mathematical facts:
- no solution means CONFLICT: an overdetermined system that disagrees;
- a target that still contains a free symbol means it is undetermined.
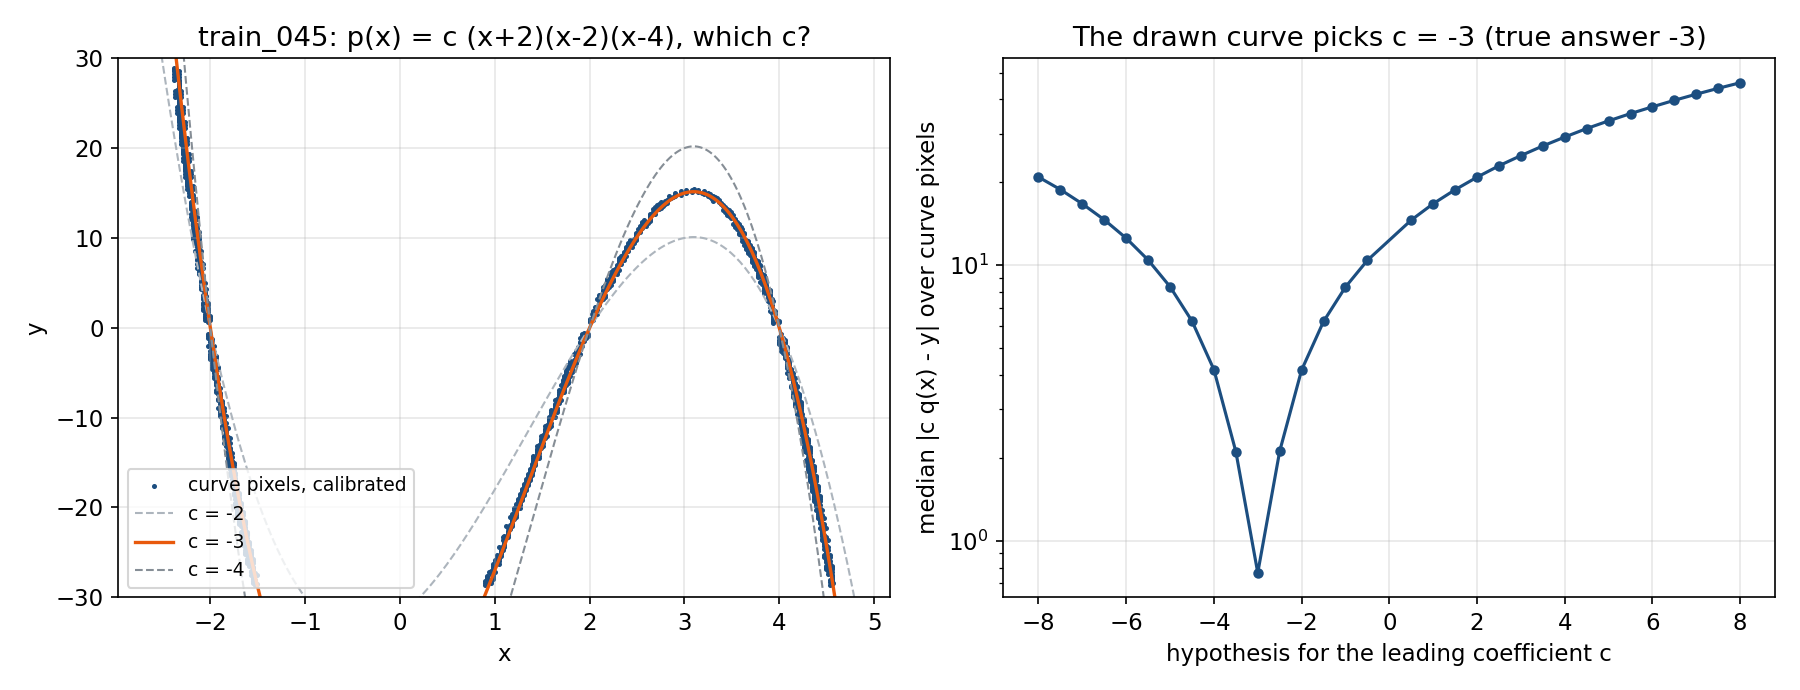
And the drawn curve is data too. In train_045, nothing gives the scale except the curve itself: the -intercept, , is off the plot. Once the axes are calibrated, every blue pixel is a noisy sample of . For the few unknowns left, we enumerate small integer or half-integer hypotheses that satisfy all labelled equations, and keep the one with the smallest robust residual:
We use the median rather than least squares because steep parts of the curve and the legend give large, meaningless errors. A problem is declared INCOMPLETE only when no calibrated axis exists, which is exactly the situation in the three training cases. The same curve also gives a second CONFLICT test: a labelled dot more than 8 pixels from the nearest curve pixel cannot be a point of .
The full solution
- OCR once per image (RapidOCR, local ONNX model, about 0.3 s per image on 2 CPU threads). Only numeric tokens (ticks) and parenthesised tokens (labels) are kept.
- Calibrate: axis lines, grid spacing, scale from tick magnitudes. Fallbacks: bottom-row ticks when the -axis is off-screen; the dots' own labels when no tick is readable.
- Detect dots (opening + connected components), convert them to data coordinates, round to integers (all labels are integers), and measure each dot's distance to the curve.
- Parse the question with about 20 regular expressions: degree (parabola/quadratic, cubic, quartic, or the number of roots), leading coefficient ("unit", "monic", ""), numeric roots (including ), symbolic roots or , a '?' root, line data for intersections, and the target, read from the last sentence (a value , the coefficient of , the leading coefficient, the -intercept, a root, , or the other crossing).
- Intersections use Vieta instead of solving for . With and , the crossings are the roots of , so their product is and the other crossing is . You do not even need . The one exception is when the labelled crossing is the -intercept (): then and the product says nothing, so is read from the curve (train_015).
- Solve as described above. Admissibility filters keep the "positive value of " and a '?' root distinct from the known ones.
sols = sp.solve(eqs, unknowns, dict=True) if eqs else [{}]
if eqs and not sols: return 'CONFLICT'                  # overdetermined and inconsistent
vals = [float(T.subs(s)) for s in sols if admissible(sp.simplify(T.subs(s)), s)]
if vals: return fmt(vals[0])                            # determined by the labels
if R.get('curve') is None: return 'INCOMPLETE'          # nothing else carries a scale
# otherwise: integer hypotheses that satisfy every label, ranked by the median residual on the curve
learn_model only builds the OCR engine. Nothing is fitted: the handful of thresholds (7-pixel opening, 8-pixel curve distance, 4 % tick agreement) were set by looking at the training images. The training score is therefore an optimistic estimate, and the honest question is how well it transfers.
Checking the test predictions without labels. The pictures contain their own answer key for many problems, in the form of the red markers: the '?' root sits at the true root, the "(?, ?)" crossing at the true crossing, the "(0, ?)" dot at the true -intercept, and the "" dot at . Our solver never uses these red positions (it treats them as unknowns), so they make an independent check. On the test set, 24 of 24 such predictions match the red markers exactly. Of the remaining 26, 6 are special cases (3 INCOMPLETE pictures with no ticks, 3 CONFLICT cases where for instance but the label says ), and the numeric ones follow from labelled points by the same algebra that scores 100 % on train.
Results
| approach | train (80, labels public) |
|---|---|
| text only, ignore the picture | 4 / 80 (5 %) |
| OCR the "(x, y)" labels, then solve | 60 / 80 (75 %) |
| geometric reading of the dots (calibrated axes), no curve | 67 / 80 (84 %) |
| first full version (curve used only for ) | 73 / 80 (91 %) |
| + curve fit for every remaining unknown, Vieta exception at , degree from the root count | 80 / 80 (100 %) |
Test set: 50 predictions written (10 INCOMPLETE/CONFLICT, 40 numbers). The official labels are private. 24 of the 24 predictions that can be checked against the picture's own red markers agree.
The jump from 84 % to 100 % came from three fixes, each found by reading a failure. When the picture has a '?' root but no labelled -intercept, the curve must supply the scale. "" without the word "parabola" was being parsed as a quartic. And the parabola-line problem whose labelled crossing is the -intercept makes the Vieta formula useless.
What to remember
- Turn a picture into numbers through its structure, not its text. Axis lines, grid spacing and marker shapes are drawn exactly; OCR is the noisy part. Use OCR only for what geometry cannot give (the scale), and combine it robustly (a median of magnitudes).
- Write one general model, and let the solver classify the special cases. "Undetermined" and "inconsistent" are exactly what a symbolic solver reports for under- and overdetermined systems. You do not need a separate classifier for INCOMPLETE and CONFLICT.
- Every pixel of a curve is a measurement. When labels are missing, a robust fit over a small, discrete hypothesis space () is exact and cheap.
- Use Vieta's formulas when they apply. The product of the roots gives the other intersection without knowing the middle coefficient, and it tells you exactly when that shortcut breaks ().
- Look for leaks, then refuse to depend on them. Image size alone predicts every special case here, a fact worth reporting in Q1. A solver that relies on it learns nothing about the problems and would collapse on a new generator.