The problem in brief
Researchers record signals from a space antenna. Each observation has a "primary signal" of 4 800 numbers and a 128-number "modulation signal" that describes how the antenna was configured. Every observation comes from one of four space objects, and you must say which one. There are 1 650 labelled training observations and 660 test observations. The statement hints that the 1-D signals hide a structure that "might be reconstructed into a more meaningful form", and that the modulation signal affects noise. This is a Kaggle simulation from the first training camp (Pelatnas 1) of Indonesia's IOAI 2026 team selection.
How you are scored
Plain classification accuracy on the test set:
The test labels and the Kaggle leaderboard require a login, so we report 5-fold stratified cross-validation accuracy on the training set and say clearly that the official test labels are private. The classes are imbalanced (700 / 500 / 300 / 150), so always predicting class 0 already gives 42.4 %.
First look at the data
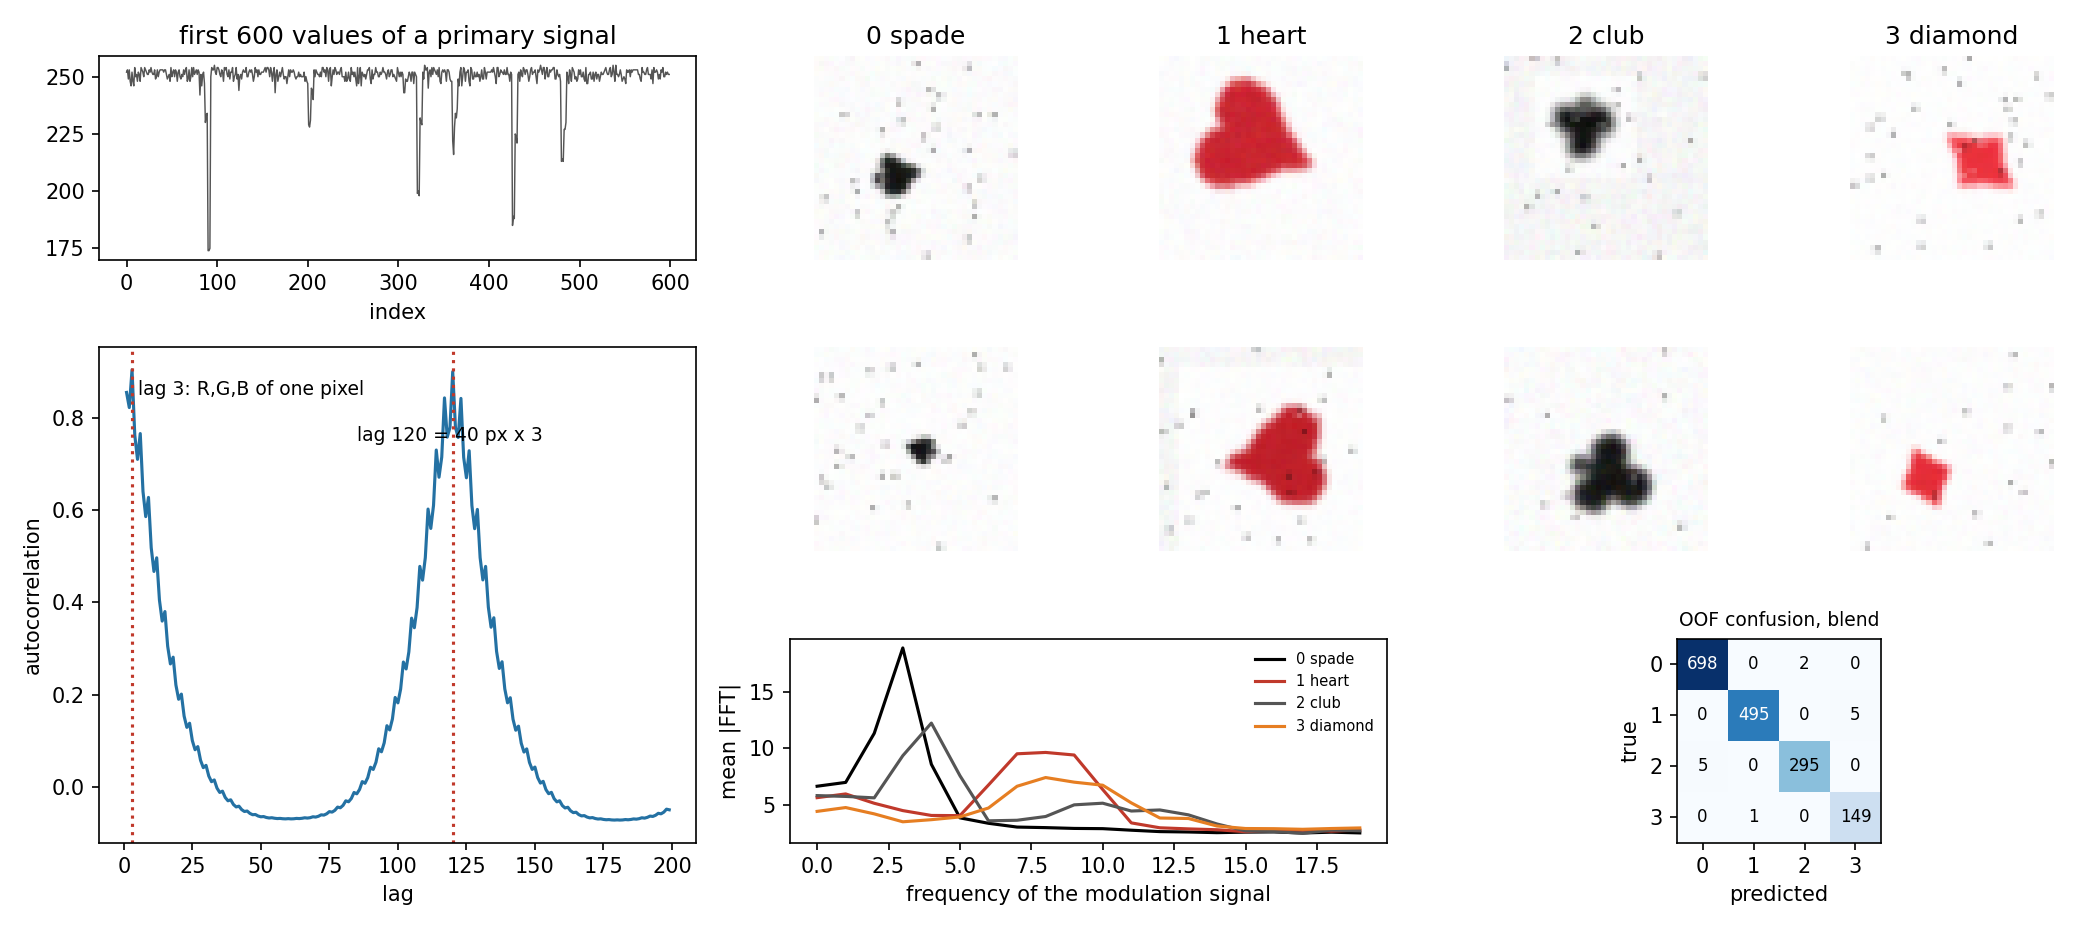
The primary signal is an image. Its values are integers from 1 to 255, like pixel intensities. The autocorrelation of the sequence has sharp peaks at lag 3 and at lag 120, a fingerprint of an image stored row by row with three colour channels: lag 3 jumps from one pixel's red value to the next pixel's red value, and lag 120 = 40 pixels x 3 channels jumps one row down. And . Reshaped to RGB, every observation shows a playing-card suit: class 0 is a spade, 1 a heart, 2 a club, 3 a diamond. The images are degraded by salt noise, blur, darker backgrounds, and random rotations, scales and positions.
The modulation signal carries class information in its frequency content. It does not explain the noise level: a ridge regression from the modulation signal to the salt-noise fraction, the background level or the blur gives . But its spectrum differs strongly between classes. Spades peak at frequency 3, clubs at 4, while hearts and diamonds have broad peaks around frequencies 7 to 10.
A first baseline
| approach | 5-fold CV accuracy |
|---|---|
| always predict class 0 | 0.424 |
| two colour features (redness, dark-pixel count), gradient boosting | 0.699 |
| raw 1-D primary signal, PCA (100) + logistic regression | 0.755 |
| same after a 3x3 median filter | 0.753 |
| modulation signal as raw values, logistic regression | 0.367 |
| modulation signal as raw values, gradient boosting | 0.786 |
Colour separates red suits from black ones but not a spade from a club. A linear model on raw pixels cannot cope with symbols that move, rotate and change size. A linear model on the raw modulation values fails, because the information is in the frequency, not in the values at fixed positions (a phase shift changes every value but not the spectrum).
The key idea
Rebuild the right representation of each signal, then use a model whose inductive bias matches it.
- The primary signal is an image of a shape that can appear anywhere, at any rotation. A convolutional network has the right biases: local filters, weight sharing (translation invariance) and pooling. We add augmentation with the transformations present in the data (90-degree rotations, left-right mirrors, small shifts), and test-time augmentation (averaging the predictions over the four rotations). The salt noise is handled by the network itself; an explicit median filter did not help the linear baseline.
- The modulation signal is a 1-D waveform whose class shows up in its dominant frequency. Its FFT magnitude is invariant to shifts in time and makes the class visible, so gradient boosting on the spectrum reaches about 91 % with no image at all.
- The two views make mostly different mistakes. The CNN sometimes confuses spade and club (similar black shapes, small after blur) or heart and diamond, while the modulation spectrum separates spades from clubs well (peaks at 3 and 4). Adding their log-probabilities combines the evidence, as a naive-Bayes product of two experts would.
The full solution
- Reshape each primary signal:
values / 255, thenreshape(40, 40, 3)and transpose to channels-first. - CNN: three blocks of (conv 3x3, BatchNorm, ReLU) x 2 + max-pool, with 32, 64 and 128 channels, then global average pooling, dropout 0.3 and a linear layer to 4 classes. Class-weighted cross-entropy (for the imbalance), AdamW and a one-cycle learning-rate schedule, 30 epochs with batch size 64 on Apple MPS, random rotation, mirror and shift at each batch.
- Modulation:
np.abs(np.fft.rfft(m)), thenHistGradientBoostingClassifierwith balanced class weights. - Blend: , with the weight chosen on out-of-fold predictions, then argmax.
def augment(x):
    x = torch.rot90(x, np.random.randint(4), (2, 3))      # suits appear rotated
    if np.random.rand() < .5: x = torch.flip(x, (3,))     # a mirrored suit keeps its identity
    dx, dy = np.random.randint(-3, 4, 2)
    return torch.roll(x, (int(dx), int(dy)), (2, 3))
The final model, trained on all 1 650 observations, predicts test classes in proportions 280 / 200 / 120 / 60. These are exactly the training proportions scaled to 660 rows, a good sign that the test set was drawn the same way.
Results
5-fold stratified cross-validation (official test labels are private):
| approach | CV accuracy |
|---|---|
| majority class | 0.424 |
| colour features + gradient boosting | 0.699 |
| raw signal, PCA + logistic regression | 0.755 |
| median filter + PCA + logistic regression | 0.753 |
| median filter + modulation, PCA + logistic regression | 0.739 |
| modulation raw values, gradient boosting | 0.786 |
| modulation spectrum, gradient boosting | 0.915 |
| CNN on reshaped images, no augmentation | 0.955 |
| CNN + augmentation | 0.967 |
| CNN + augmentation + test-time augmentation (4 rotations) | 0.979 |
| blend CNN + modulation spectrum (final) | 0.992 |
The blend makes 13 errors out of 1 650: 5 hearts predicted as diamonds, 5 clubs as spades, 2 spades as clubs, and 1 diamond as a heart. The single blend weight was picked on the same out-of-fold predictions, so 0.992 is very slightly optimistic. The gain over the CNN alone (36 errors) is far larger than this selection effect.
What to remember
- Look at the raw numbers and their autocorrelation. Values from 1 to 255, peaks at lags 3 and 40 x 3, and revealed that the "1-D signal" was an RGB image.
- Choose the representation before the model: images go to a CNN with augmentation matching the variations in the data, and waveforms go through an FFT when the information lives in frequencies.
- Test what an auxiliary input really encodes. The modulation signal was described as an antenna setting linked to noise, but it predicted nothing about noise and a lot about the class.
- Blend complementary views: two models with different error patterns, combined in log-probability space, beat either one by a wide margin.
- Use class weights for imbalanced classes, and check the predicted class proportions on the test set as a sanity check.