The problem in brief
A laboratory measured 11 physicochemical properties of Portuguese red Vinho Verde wines: acidity (fixed, volatile, citric), residual sugar, chlorides, free and total sulfur dioxide, density, pH, sulphates and alcohol. Expert tasters gave each wine a quality score, here between 3 and 8. You must predict that score for unseen wines. The classes are very unbalanced: the scores 5 and 6 cover most of the data, and there are only a handful of 3s and 8s.
The Kaggle files need a login, so we rebuilt the task from its public source, the UCI Wine Quality dataset (red wines, 1 599 rows, Cortez et al., 2009). The official training file has 1 279 rows and 8 wines of quality 3, which is exactly a stratified 80 % of the UCI data. So we made the same kind of split: 1 279 training wines and 320 held-out wines (the size of the official validation file), stratified by quality, seed 42. All scores below are on our held-out 320 wines, not on the official Kaggle test set.
How you are scored
The metric is the weighted F1 score. For each class with true examples, precision and recall :
Unlike the macro F1, each class weighs in proportion to its size, so classes 5 and 6 make up about 82 % of the score, and missing every wine of quality 3 costs almost nothing. The score is turned into points:
so 0 points at and 100 points at . Always predicting 5 gives , hence 0 points. No leaderboard is visible without a login, so the only published target is this scale.
First look at the data
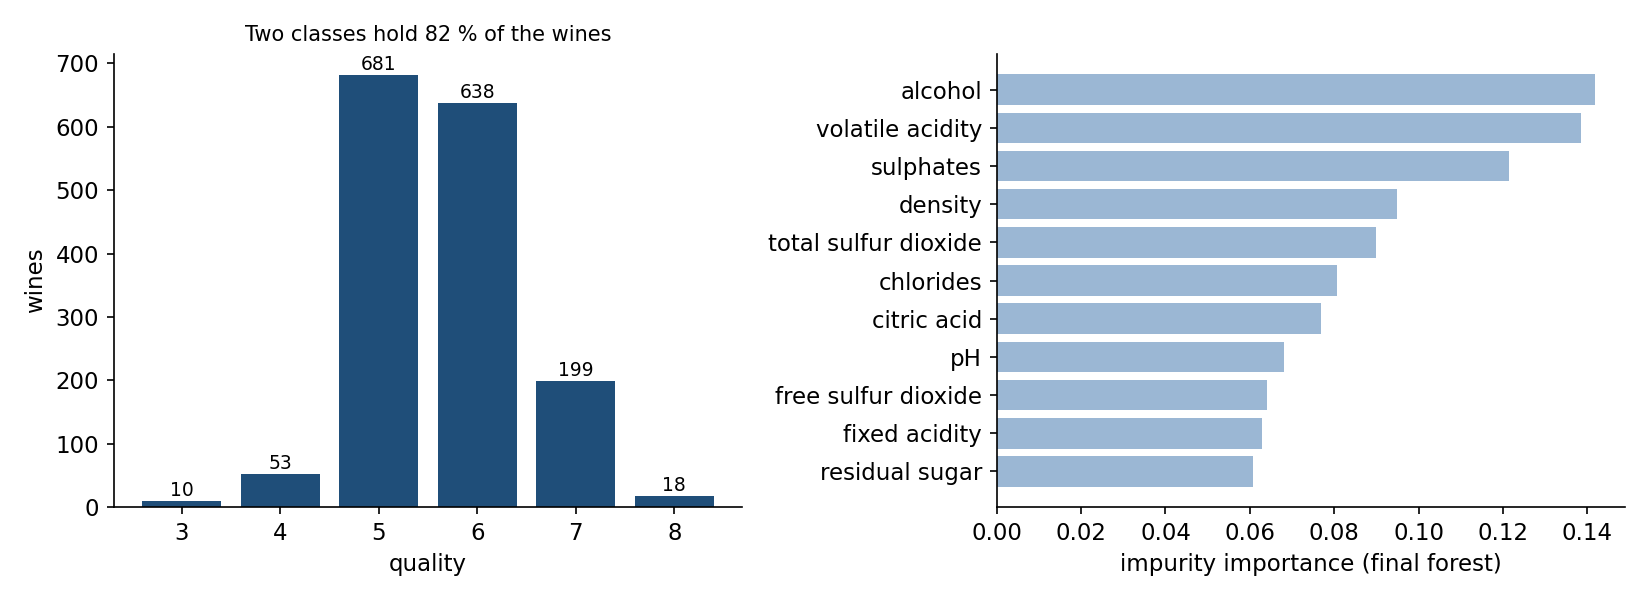
Nothing is missing and all values are physically plausible. Three observations matter.
- The classes are unbalanced (left panel): 681 wines of quality 5, 638 of quality 6, then 199, 53, 18 and 10.
- A few features carry most of the signal (right panel): alcohol, volatile acidity (the vinegar taste) and sulphates. Wines with more alcohol and less volatile acidity get better marks. The others help a little.
- The dataset contains 240 exact duplicate rows. They are not data entry errors: the same wine, or identical analyses, appear several times, always with the same quality. After our random split, 76 of the 320 held-out wines have an exact twin in the training set.
That last point drives everything below. A model that memorises the training rows, such as a random forest whose fully grown trees isolate single wines, gets those 76 wines right for free. Whether that is "cheating" depends on the test set: if the official test set is built the same way as ours (a random split of a dataset with duplicates), twins will be there too, and memorising pays. But the score then says less about how well you predict a new wine.
A first baseline
Logistic regression on standardised features: held-out , i.e. 28 points. It already captures the main trends (alcohol up, volatile acidity down), but a linear boundary in 11 dimensions is too rigid to separate 5 from 6, the two big neighbouring classes.
The key idea
Measure your models in two ways: with twins kept together, and without. The trick is grouped cross-validation: we give every set of identical wines the same group number and use StratifiedGroupKFold, so a wine and its twins always land in the same fold. This tells you how well the model predicts wines it has never seen. Ordinary (naive) CV lets twins sit on both sides of the split, exactly as our random held-out split does.
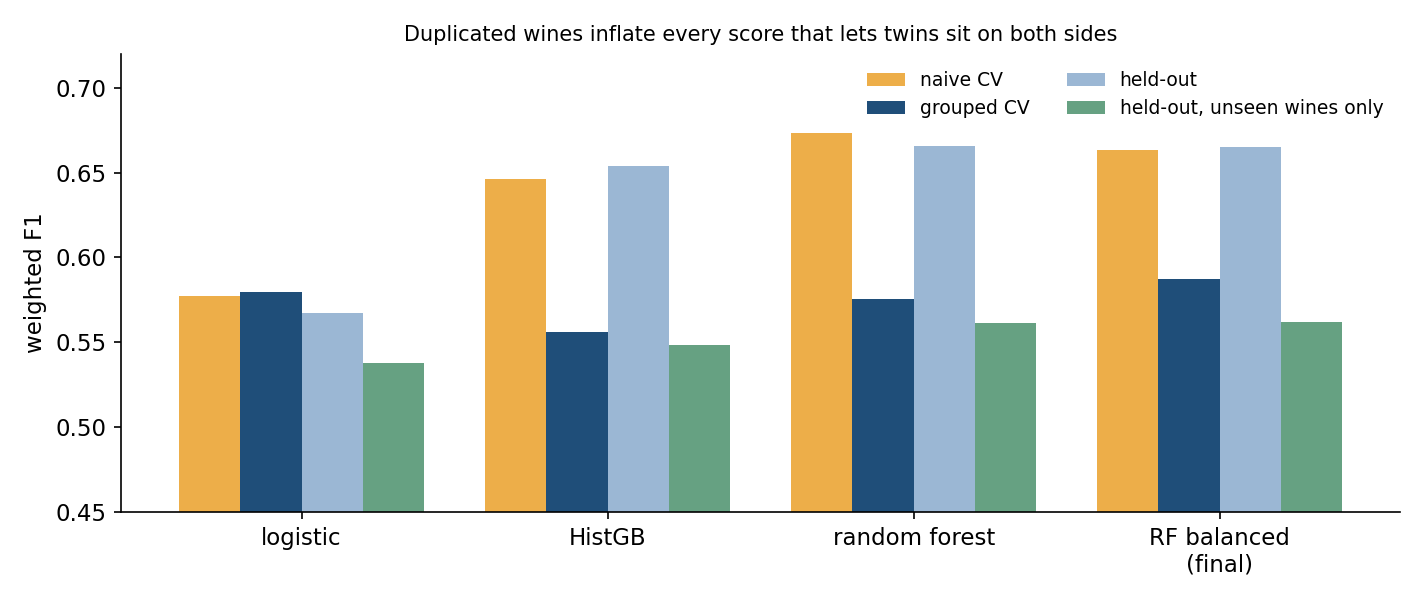
The figure is the core of this correction.
- For logistic regression, naive CV and grouped CV agree (0.577 and 0.579). A smooth model cannot memorise single points, so twins do not help it.
- For gradient boosting and random forests, naive CV is about 9 points above grouped CV (0.673 against 0.576 for the forest). The held-out score (0.666) sides with naive CV, because 76 of its wines have twins in train. On the 244 held-out wines without a twin, the forest drops to 0.561.
So the "honest" level of this problem, for genuinely new wines, is about 0.56 to 0.59 weighted F1, and memorisation adds about 10 points when twins are present. Two consequences:
- Choose hyperparameters on grouped CV. On naive CV, the most memorising forest always wins. Grouped CV prefers a slightly smoother forest (at least 2 wines per leaf) with class weights that help the rare classes.
- Use a forest anyway. Even judged honestly, forests beat logistic regression (0.587 against 0.579 in grouped CV), and they keep the memorisation bonus on any test set that contains twins. You lose nothing by picking the forest, as long as you know what the score means.
The full solution
- Load the 1 599 red wines and group identical rows (240 duplicates).
- Make the stratified 1 279 / 320 split.
- Compare logistic regression, histogram gradient boosting and random forests by naive CV, grouped CV and held-out score.
- Tune the forest by grouped 5-fold CV over the minimum leaf size (1, 2, 4) and the number of features tried per split ( or half), with
class_weight="balanced_subsample". - Final model: 500 trees, at least 2 wines per leaf, features per split, balanced class weights, refit on all 1 279 training wines.
group = X.round(6).astype(str).agg("|".join, axis=1).factorize()[0]   # identical wines share a group
cv = StratifiedGroupKFold(5, shuffle=True, random_state=0)
pred = cross_val_predict(model, Xtr, ytr, cv=cv, groups=gtr)          # twins never split across folds
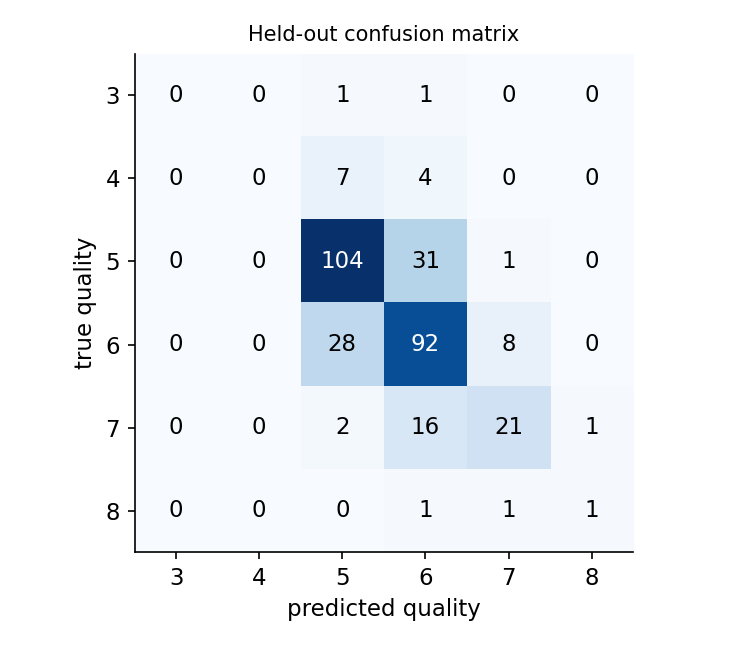
The confusion matrix shows the limits. Of the 102 errors, 92 are off by exactly one point, mostly 5 against 6 (31 + 28) and 7 predicted as 6 (16). The model never even predicts a 3 or a 4, despite the class weights (F1 of 0 for both), and the 8s only partly (F1 0.40). Per-class F1 is 0.75 for class 5, 0.67 for class 6 and 0.59 for class 7. That is natural: each score is the median of a few tasters' marks, so neighbouring scores overlap, and with 8 examples of quality 3 in training there is no way to learn that class. The weighted F1 barely notices, since classes 3, 4 and 8 together weigh about 5 % of the score.
We also tried treating quality as a number: a random forest regressor, rounded to the nearest integer. Its grouped CV score is 0.579, no better than the classifier: a regressor averages towards the middle, so after rounding it predicts the extreme scores even less often.
Results
| model | naive CV | grouped CV | held-out (320) | held-out, 244 unseen wines |
|---|---|---|---|---|
| always predict 5 | 0.255 | 0.255 | 0.254 | 0.251 |
| logistic regression | 0.577 | 0.579 | 0.567 | 0.538 |
| gradient boosting (HistGB) | 0.646 | 0.556 | 0.654 | 0.548 |
| random forest, default | 0.673 | 0.576 | 0.666 | 0.561 |
| RF regressor, rounded | 0.579 | 0.667 | ||
| RF balanced, leaf 1, max_features 0.5 | 0.671 | 0.578 | 0.671 | 0.568 |
| RF balanced, leaf 2, max_features √ (final) | 0.663 | 0.587 | 0.665 | 0.562 |
(weighted F1; the final model is the one with the best grouped CV)
Our final model reaches on the held-out wines, i.e. 44 points on the competition scale. On wines with no twin in the training set, it scores 0.562 (27 points). Note that another forest has a slightly better held-out score (0.671): choosing it would mean choosing on the test set, which we do not do. The 0.006 gap is noise anyway.
What to remember
- Look for exact duplicates before you split. Here 15 % of rows are copies, and they put twins on both sides of any random split.
- Grouped CV measures generalisation, naive CV measures memorisation plus generalisation. If the two disagree a lot, your model is memorising. Logistic regression showed no gap; forests showed 9 points.
- Know which question your test set asks. If it was drawn the same way as the training data, memorisation pays and you should keep it. If it contains new wines, only the grouped score is meaningful.
- Read the metric's weights. A weighted F1 ignores rare classes almost completely, while a macro F1 would make classes 3 and 8 worth as much as 5 and 6.
- Noisy labels cap the score. 90 % of the errors are off by one point, the natural blur of a human tasting score: no model will reach 100 points here.