The problem in brief
A retail store has 1 000 customers described by 19 columns: age, gender, income, spending score, number of purchases, total and average purchase value, discounts, loyalty score, preferred store section, payment method, and so on. The task is presented as customer segmentation, but the training file of 800 customers already contains a Cluster column (0 to 4) produced by "the clustering algorithm". You must give the cluster of the 200 remaining customers. In other words: find out how the organisers made their clusters, and apply the same thing to the test customers.
The data are the official Kaggle files. The test labels are private and we did not submit anything: our scores come from the 800 labelled training rows, including a held-out simulation that mimics the test.
How you are scored
The Adjusted Rand Index compares two partitions without caring how the clusters are numbered. Over all pairs of customers, it counts how often the two partitions agree on "same cluster" versus "different clusters", then corrects for chance:
where RI is the fraction of pairs on which the partitions agree. A random labelling scores about 0 and a perfect one 1, whatever the numbering of the clusters.
What to aim for. No threshold is published. On the public leaderboard four entries score ARI = 1.000, then 0.977 and 0.952.
First look at the data
- No missing values. The test file looks like the training file with a little random noise added: integer columns have decimals, and some values leave the valid range (a spending score of , purchases).
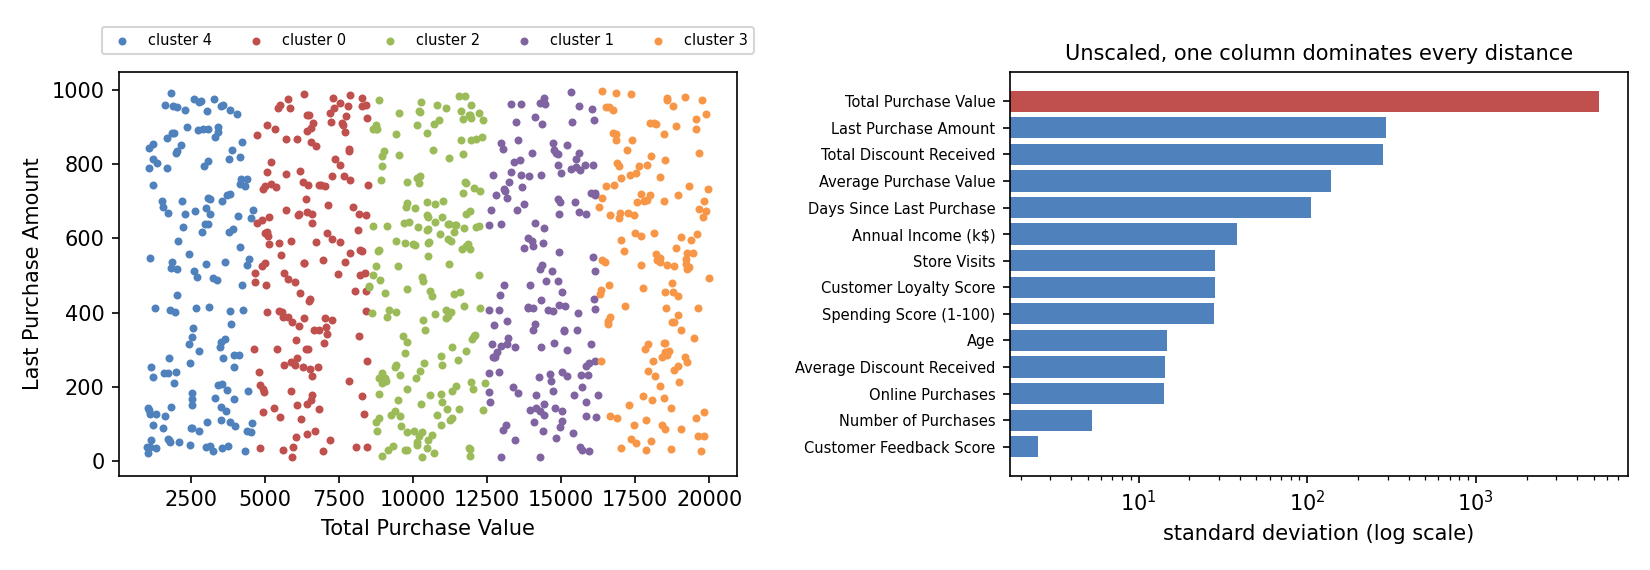
- The five clusters have almost identical averages on every column except one: Total Purchase Value (cluster means 2 779, 6 514, 10 496, 14 415 and 18 148). Each cluster is a band of total spending, and the bands do not overlap at all in the training data: for example cluster 4 spans 1 028 to 4 587 and cluster 0 spans 4 636 to 8 492.
A first baseline
The textbook pipeline (the one a careful student would write first): standardise every column, then run K-Means with . Its clusters have ARI 0.081 with the given labels, almost no agreement. The clusters in the file were not made this way.
The key idea
K-Means minimises Euclidean distances, so it is only as good as the scale of the columns you give it. The total squared distance from a point to a centroid is a sum over columns:
Without scaling, a column with a standard deviation of 5 400 (Total Purchase Value) contributes about times more than the next largest columns (Last Purchase Amount and Total Discount Received, around 290). The right panel shows this on a log scale. So K-Means on raw columns is, in practice, K-Means on Total Purchase Value alone, and in one dimension K-Means cuts the line into consecutive intervals. That is exactly the band structure we see. The slight tilt of the boundaries in the left panel comes from the second-largest column, Last Purchase Amount, which still has a small say.
The hypothesis "the organisers ran K-Means with on the raw numeric columns of all 1 000 customers" can be tested:
- K-Means on the raw columns of the 800 training rows only: ARI 0.978. The boundaries move a little, because the centroids are computed from 800 customers instead of 1 000.
- K-Means on the raw columns of train and test together (all 1 000 customers): ARI 1.000 on the training rows. Every one of the 800 given labels is reproduced exactly.
So we have the organisers' procedure. In a real project, unscaled K-Means would be a mistake, since it ignores 13 of the 14 numeric columns. Here it is the definition of the target, so we must copy it, mistake included.
The full solution
- Take the 14 numeric columns, without
CustomerIDand without the categorical columns (adding them changes nothing, their 0/1 encodings are negligible next to a scale of thousands). - Stack train and test (1 000 rows) and run K-Means with and 20 initialisations, without scaling.
- Output the cluster of each test row. No need to renumber clusters to match the training labels: ARI ignores the numbering.
lab = KMeans(n_clusters=5, n_init=20, random_state=0).fit(np.r_[X, T]).labels_
sub = pd.DataFrame({"CustomerID": te.CustomerID, "Cluster": lab[len(X):]})
How we validated. The test rows carry noise, and a test customer whose total spending sits near a band boundary could be pushed to the wrong side. We estimated the noise in each column from how far test values overshoot the training range (the maximum of 200 normal draws is about 2.7 standard deviations, which gives a noise of about 35 on Total Purchase Value). Then we hid a quarter of the training labels, added that noise to the hidden rows, reran the full procedure, and scored the hidden rows. We repeated this for each of the 4 quarters.
Results
| approach | ARI | evaluated on |
|---|---|---|
| K-Means on standardised columns (textbook) | 0.081 | 800 training rows |
| K-Means on raw columns, train rows only | 0.978 | 800 training rows |
| nearest labelled centroid, 5-fold CV, clean rows | 0.987 | 800 training rows |
| K-Means on raw columns, train + test (final) | 1.000 | 800 training rows |
| final procedure, hidden quarters with test-like noise | 0.975 (0.939 to 1.000) | 4 × 200 held-out rows |
On the real test, 9 of the 200 customers have a total spending within 100 of a band boundary, so a couple of them may land on the wrong side because of the noise. Our noise estimate is rough, so 0.975 is a careful estimate: since four teams reached 1.000 on the public leaderboard, the real noise most likely moved no test customer across a boundary.
What to remember
- Scale before K-Means, or know why you do not. Euclidean distance on raw columns is dominated by the column with the largest variance. Here that turned a 14-column clustering into a 1-column one.
- When a label is "the output of an algorithm", reverse-engineer the algorithm. Test hypotheses by how well they reproduce the given labels: standardised K-Means gave 0.08, raw K-Means on all rows gave 1.000.
- Clustering is transductive. The centroids depend on every point you cluster, so rerunning on the full set of customers (train and test) reproduces the organisers' boundaries, whereas fitting on the training rows alone shifts them.
- ARI does not care about cluster names. You never need to match your cluster numbers to the given ones, which is convenient for unsupervised predictions.
- Check per-cluster averages of every column. When five clusters differ on only one column, that column is the clustering.