The problem in brief
You get 800 students described by 38 columns (study hours, sleep, IQ, attendance, family income, favourite subject, number of pets...) together with their final test score, and you must predict the score of 800 other students. The statement walks you through the classical toolbox: impute missing values, scale the features, try Ridge and Lasso. The real lesson is elsewhere. Look at the data closely enough and you find that the target is a simple formula, and that the "new" students are not new at all.
The data are the official Kaggle files. The test labels are private and we did not submit anything. Our scores come from cross-validation on the training set, and from a self-made copy of the test that mimics its construction exactly.
How you are scored
The coefficient of determination on the test scores :
is a perfect prediction; predicting the mean everywhere gives 0.
What to aim for. No threshold is published. On the public leaderboard three entries have , followed by 0.997.
First look at the data
- There are no missing values in either file, despite the statement's long section on imputation.
- The training columns look like real survey answers: integers for attendance, binary 0/1 for part-time job, gender, favourite subject. The test columns do not: attendance 85.498, homework completed 0.106, gender , a negative number of pets. Every test value looks like a clean value plus a little random noise.
- The scores lie between 55 and 100, with 5 students at exactly 100 (a cap).
A first baseline
Plain linear regression, 5-fold cross-validation on the training set: . The fit is almost perfect, and the coefficients explain why:
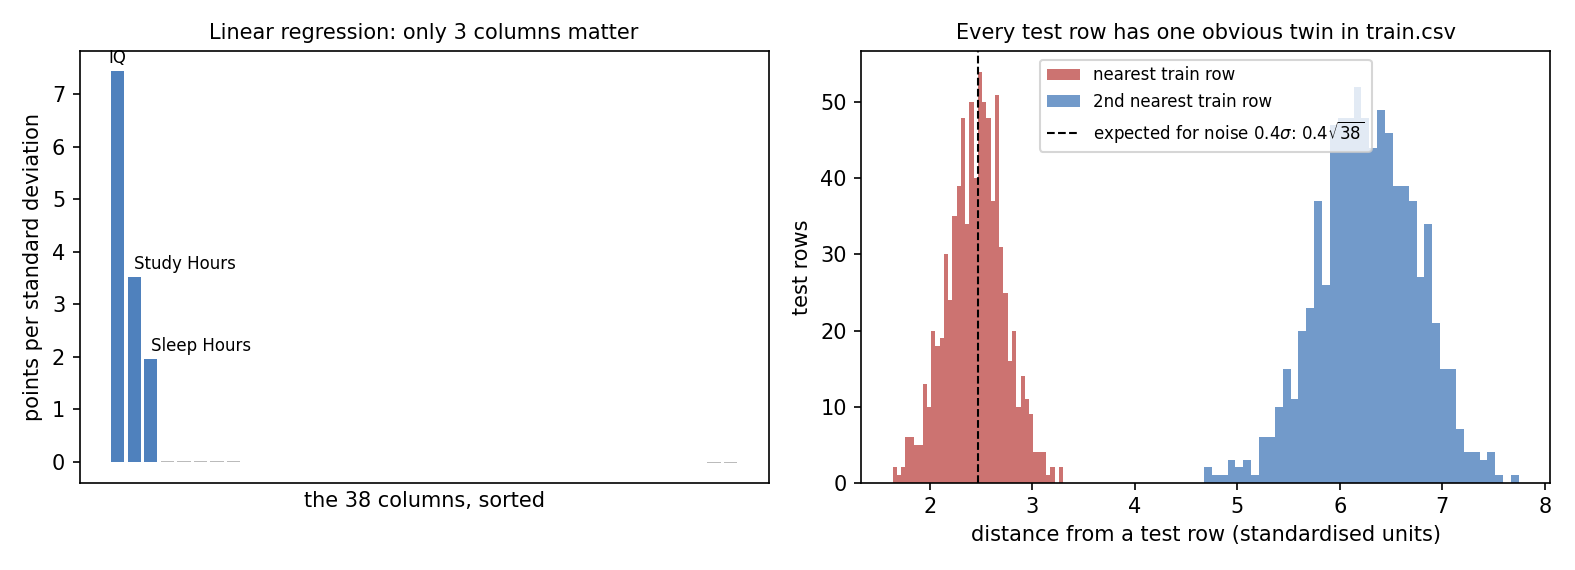
Only IQ (7.4 points per standard deviation), Study_Hours (3.5) and Sleep_Hours (2.0) matter. The other 35 columns have coefficients near 0.01: they are decoys from the data generator. The remaining 0.05 % of variance is the cap at 100. Lasso, the statement's suggestion for feature selection, does worse here (0.87 with the default cross-validated penalty), because it shrinks the three true coefficients along with the useless ones.
But the test rows are noisy, and a model fitted on clean rows does not see the same inputs at test time. To measure what really happens, we add noise of the same size to the validation rows (see below how we measured it). The linear model then drops to .
The key idea
Ask how a test row relates to the training rows before you model anything. For each test row, compute its distance to every training row after standardising the columns. The right panel above shows the result: every test row has one training row at distance about 2.5, and the next closest is at about 6.3. There is no overlap at all between the two histograms, and the 800 nearest neighbours are 800 different training rows.
That is exactly what you would see if the test set were the training set, shuffled, with independent Gaussian noise added to every column. Check the numbers: if each of the 38 standardised columns gets noise of standard deviation , the distance to the original row is about . The measured spread of (test minus matched train) is in every single column, and , which is exactly where the red histogram peaks. Two unrelated students, on the other hand, differ by about before noise, and the closest of 800 of them is around 6.
So the test students are the training students in disguise. Matching each test row to its twin and copying the twin's score gives the exact answer. To make the matching one-to-one, we solve an assignment problem: find the permutation that minimises
where are the standardised test rows and the training rows, with the Hungarian algorithm (scipy.optimize.linear_sum_assignment). Here it agrees with the plain nearest neighbour on all 800 rows, because the gap between first and second neighbour is so large.
Why can no model reach on these test rows? It is the errors-in-variables effect. Suppose, in standard units, and you observe with noise variance . The best you can do from is
which explains only a fraction
of the variance. This holds feature by feature, so it holds for the whole linear score too. Training on noisy copies of the training rows learns exactly this shrunken slope, and reaches 0.872 in our cross-validation (the small excess over 0.862 is sampling noise). The information lost to the noise in IQ is gone. It can only be recovered by finding the clean row the noise was added to.
The full solution
- Standardise the 38 columns with the training means and standard deviations.
- Compute all squared distances between test and training rows.
- Solve the assignment problem, and predict for each test row the
Test_Scoreof its assigned training row.
How we validated the matching. We built a self-made test: the training set shuffled, plus Gaussian noise of 0.4 standard deviations in every column. The assignment recovered 100 % of the rows, so . It still recovers 100 % with noise of 1.0 standard deviation, and breaks down at 2.0 (37 % of rows): the method has a wide safety margin. On the real test, a last consistency check: the scores we copy and the linear model's predictions on the noisy test rows agree with , the same value as our noisy cross-validation (0.855), as expected if the copied scores are the truth.
Results
| approach | evaluated on | |
|---|---|---|
| Lasso, cross-validated penalty, clean validation | 0.868 | 5-fold CV |
| linear regression, all columns, clean validation | 0.9994 | 5-fold CV |
| gradient boosting, clean validation | 0.984 | 5-fold CV |
| linear regression, all columns, noisy validation | 0.855 | 5-fold CV + test-like noise |
| gradient boosting, noisy validation | 0.838 | 5-fold CV + test-like noise |
| linear, 3 key columns, trained on noisy copies | 0.872 | 5-fold CV + test-like noise |
| theoretical ceiling for any model of the noisy inputs | 0.862 | formula above |
| twin matching (assignment), final | 1.000 | self-made noisy shuffled copy |
The public leaderboard's top score of 1.000 is consistent with this: the leading teams evidently found the same thing.
Is this fair play? The statement does not forbid it, and the test data reveal it to anyone who looks. As a lesson about real projects, it is a classic train/test leakage story: if your "new" data are noisy duplicates of your training data, any score you measure on them says nothing about new students. Always check for near-duplicates between your splits.
What to remember
- Look at the raw test values, not just the training ones. Integers that became decimals, binary columns with negative values: these are signs that the test set was built differently.
- Nearest-neighbour distances are a powerful diagnostic. A clear gap between the first and second neighbour means duplicates, and here it turned a regression problem into a matching problem.
- Noisy inputs put a ceiling on . With noise variance relative to the signal, the best possible is about . Training on inputs noised the same way learns the right, shrunken coefficients.
- Matching with a one-to-one constraint is an assignment problem, solved exactly by the Hungarian algorithm in a fraction of a second for 800 rows.
- The statement's checklist is not always the problem's key. There were no missing values, scaling does not change a linear regression, and Lasso hurt. Your own exploration decides what matters.