The problem in brief
Each "group" is a cloud of 400 points in random order. Behind every group hide four curves, 100 points each: an exponential , a logarithm , a sinusoid and a line , all with Gaussian noise added to . Nobody tells you which point belongs to which curve. From the 400 points you must recover all 11 parameters. You get 400 training groups with their true parameters and must predict the parameters of 200 test groups. It is a regression problem in disguise: the real difficulty is the missing labels, which turns it into an unsupervised mixture of regressions.
How you are scored
The metric is the root mean squared error over every predicted parameter of every test group,
The organisers define a baseline (k-means with on the points, then fit every family on every cluster and keep the best fit per family), and the final score is , where is the best contestant's RMSE. Neither nor is published, and the test parameters are private, so all numbers below are measured on the 400 training groups, whose true parameters are given. Our method learns only a handful of global constants from them (the parameter ranges, the ranges, the noise level), so this validation is honest up to those 15 or so numbers.
First look at the data
Plotting a few groups and comparing with the training parameters reveals a lot of structure that the statement does not spell out:
- Every family lives on its own interval. A histogram of all values is piecewise flat, and the jumps sit at , , , about , , and . Matching levels gives: line on , exponential on , log on , sine on , each uniform. So a point with is surely on the line, and a point with surely on the sine.
- The parameters are uniform in a box: , , , , , , , , , , .
- The noise is Gaussian with , the same in every group (measured on the points with and , whose family is known; kurtosis 2.98, close to the Gaussian 3).
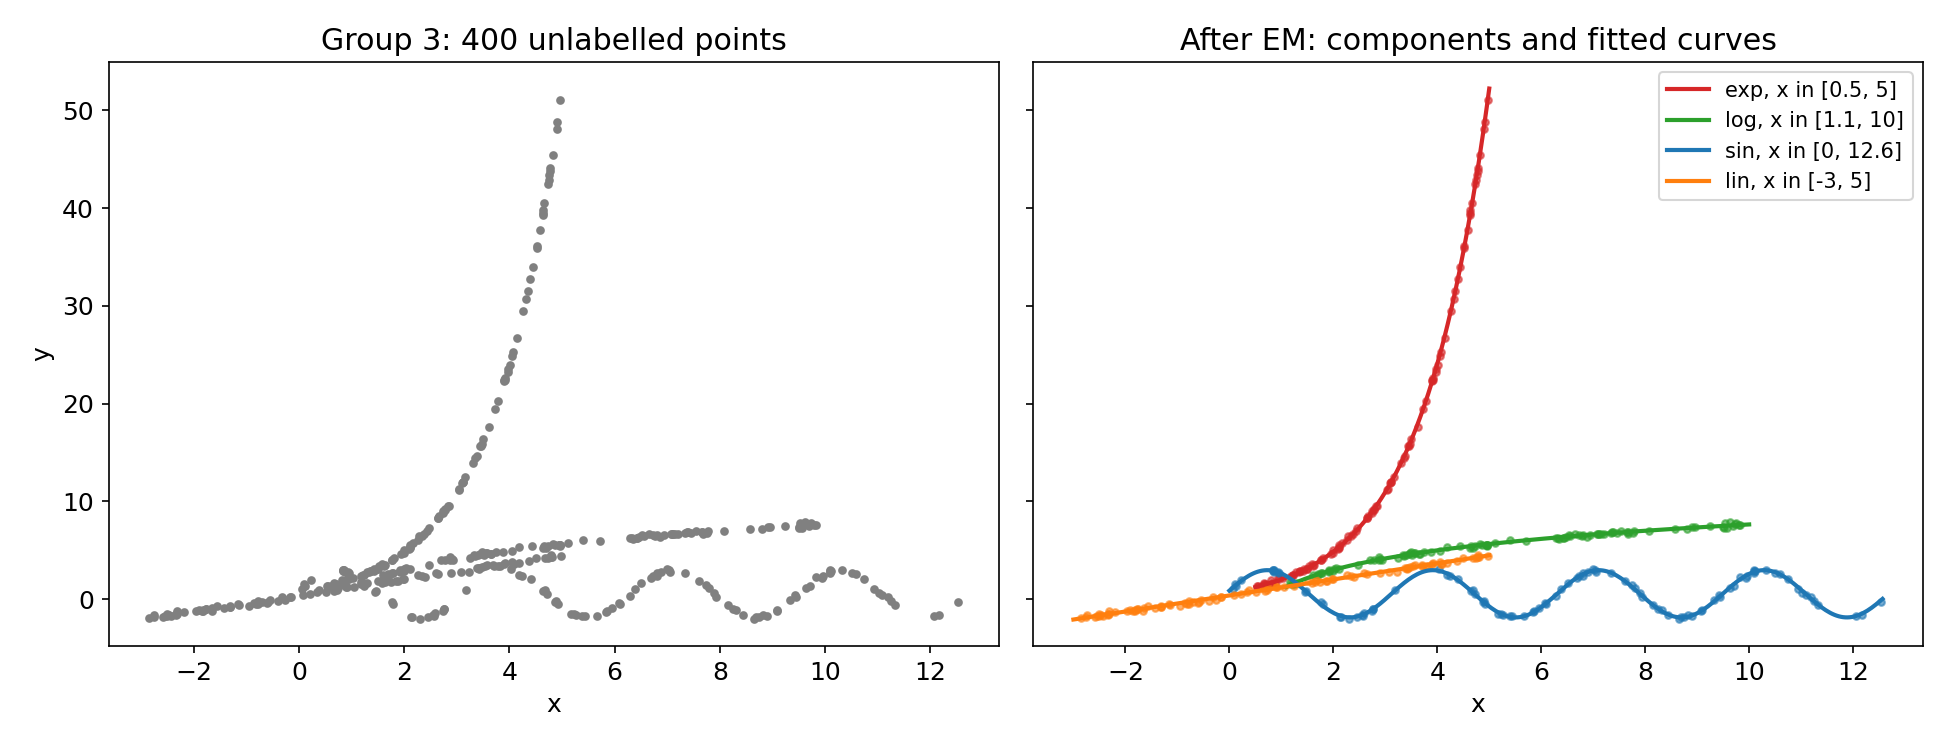
The curves cross each other in the region , where all four families are active and where most of the ambiguity lies.
A first baseline
Predicting the centre of every parameter box gives RMSE 0.621: that is the "know nothing" level. The organisers' k-means baseline does worse than that out of the box: k-means groups points that are close in the plane, not points on the same curve, so clusters mix families, curve_fit then diverges on some of them and returns absurd values (RMSE 8687 on the training groups). Clipping its outputs to the parameter box rescues it to 1.009, still above the constant guess. The lesson: geometric clustering ignores the very thing that defines a cluster here, the functional form.
The key idea
Treat each group as a mixture model and let the curves themselves do the clustering. For component with parameters , a point's likelihood is
The EM algorithm alternates:
- E-step: responsibilities , i.e. "how plausible is it that point was produced by curve ". The uniform factor is 0 outside , so the known -ranges are used automatically.
- M-step: refit each curve by weighted least squares, every point weighted by its responsibility.
Each iteration cannot decrease the likelihood, so EM converges, but only to a local optimum. Four ingredients make it reliable:
- Deterministic annealing. Start with a large (1.0) so that responsibilities are soft and every curve feels every point, then shrink it to the true 0.12 over 40 iterations. Early on the curves move to the right regions; at the end assignments become sharp.
- Balanced assignments. Each family owns exactly 100 points. We enforce it with a few Sinkhorn iterations on the responsibility matrix (alternately normalise rows to sum to 1 and columns to sum to 100), which stops one curve from swallowing another's points.
- Separable fits. Every family is linear in its parameters once one nonlinear parameter is fixed: given , is linear in ; given , is linear in with , . So we grid-search the one nonlinear parameter, solve the linear part exactly, and polish with a bounded least-squares step. No bad starting point for
curve_fit, no divergence. - A swap search. The typical remaining failure is two families exchanging their points, for instance a nearly straight exponential (small ) taking the line's points while the line bends to cover the exponential's points. Once EM has converged, we try every pair of families: refit each on the points the other owns, run a short, cool EM, and keep the result if the likelihood improves. This one step fixed all ten worst training groups (their squared error dropped from 1.3 to 8.1 down to 0.01 to 0.15).
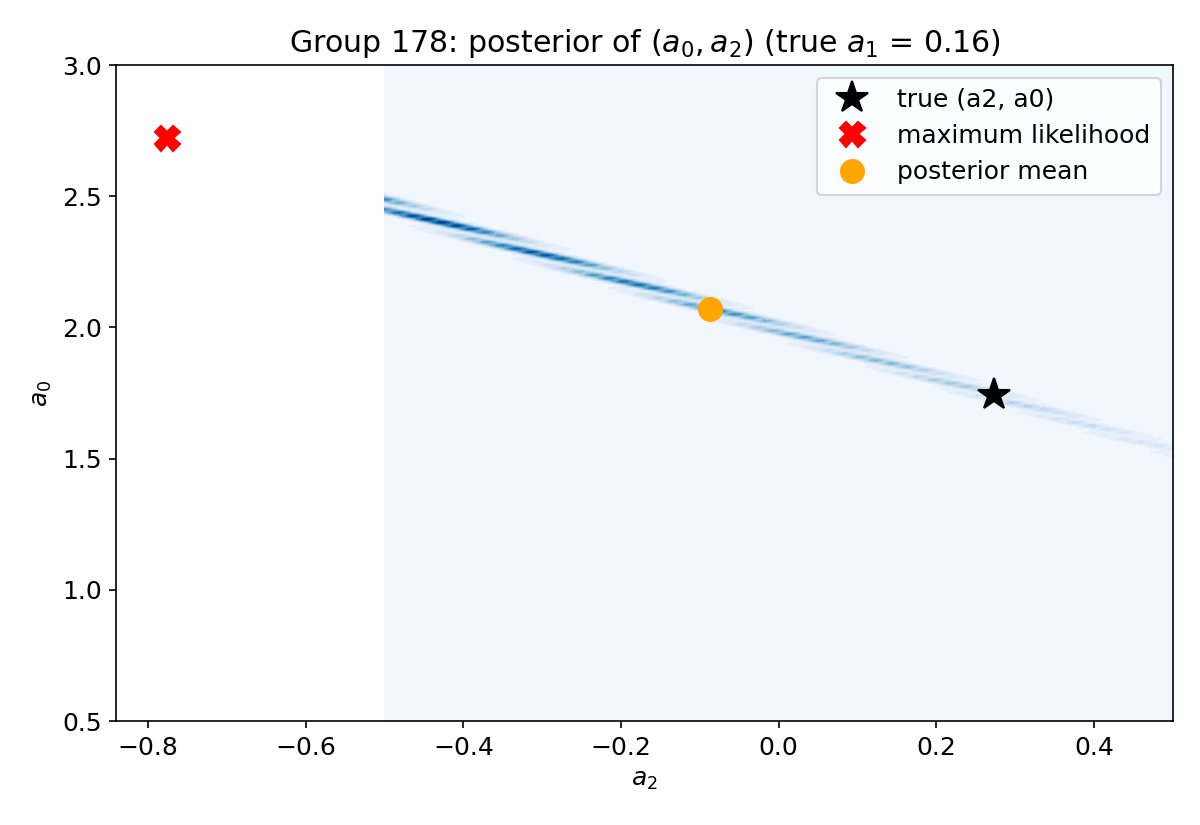
Then comes the second idea, specific to the metric. RMSE rewards the posterior mean, not the most likely value. The exponential's parameters are often poorly determined: when is small, over , so many pairs along a ridge fit the 100 points equally well. Maximum likelihood picks some point on that ridge, sometimes far outside the plausible box. Because the true parameters are uniform in a known box, we can compute the exact posterior on a grid and report its mean, which minimises the expected squared error:
The residual sum of squares for a fixed is a quadratic in that can be evaluated on a whole grid from six weighted sums, so a grid takes a fraction of a second. We do the same for the log and the line (2-D grids); the sine parameters are so well determined (RMSE about 0.02) that the maximum-likelihood fit is kept.
The full solution
For each group (solve_group in solution.py):
- Run annealed, Sinkhorn-balanced EM from two starts (box centres, plus one random draw from the box), keep the higher likelihood.
- Run the pairwise swap search until no swap improves the likelihood.
- Using the final responsibilities as weights, replace the exponential, log and line parameters by their posterior means under the uniform box prior; canonicalise the sine (, ).
The core E-step is short:
for s in np.geomspace(1.0, SIGMA, iters):                  # annealing
    P = np.stack([f(k, th[k], x) for k in KS], 1)          # predictions of the 4 curves
    ll = -0.5 * ((y[:, None] - P) / s) ** 2 + np.log(px)   # px = uniform x-range densities
    R = np.exp(ll - ll.max(1, keepdims=True))
    for _ in range(30):                                     # Sinkhorn: 100 points per curve
        R /= R.sum(1, keepdims=True); R *= (n / 4) / R.sum(0, keepdims=True)
    th = {k: fit(k, x, y, R[:, j]) for j, k in enumerate(KS)}   # weighted M-step
A whole run (400 validation groups, then the 200 test groups) takes about 30 minutes on one CPU core and writes submission.csv in the sample-submission format.
Results
All RMSEs over the 11 parameters of the 400 training groups (true parameters known).
| approach | RMSE |
|---|---|
organisers' baseline: k-means + curve_fit (raw) | 8687 |
| same, clipped to the parameter box | 1.009 |
| constant: centre of every box | 0.621 |
| first EM: one start, unbounded fits, no balancing (20 groups) | 93.8 |
| EM, one start, bounded separable fits + Sinkhorn balancing (40 groups) | 0.491 |
| EM, four starts, maximum likelihood | 0.155 |
| same + posterior means | 0.113 |
| EM, two starts + swap search, maximum likelihood | 0.097 |
| same, clipped to the box | 0.086 |
| EM + swap search + posterior means (submitted) | 0.0555 |
Per parameter, the final errors are : 0.112, : 0.011, : 0.135, : 0.022, : 0.038, : 0.018, : 0.003, : 0.023, : 0.013, : 0.006, : 0.014. The exponential's offset and amplitude carry most of the remaining error, and that error is mostly irreducible: it is the width of the posterior ridge, not a fitting failure.
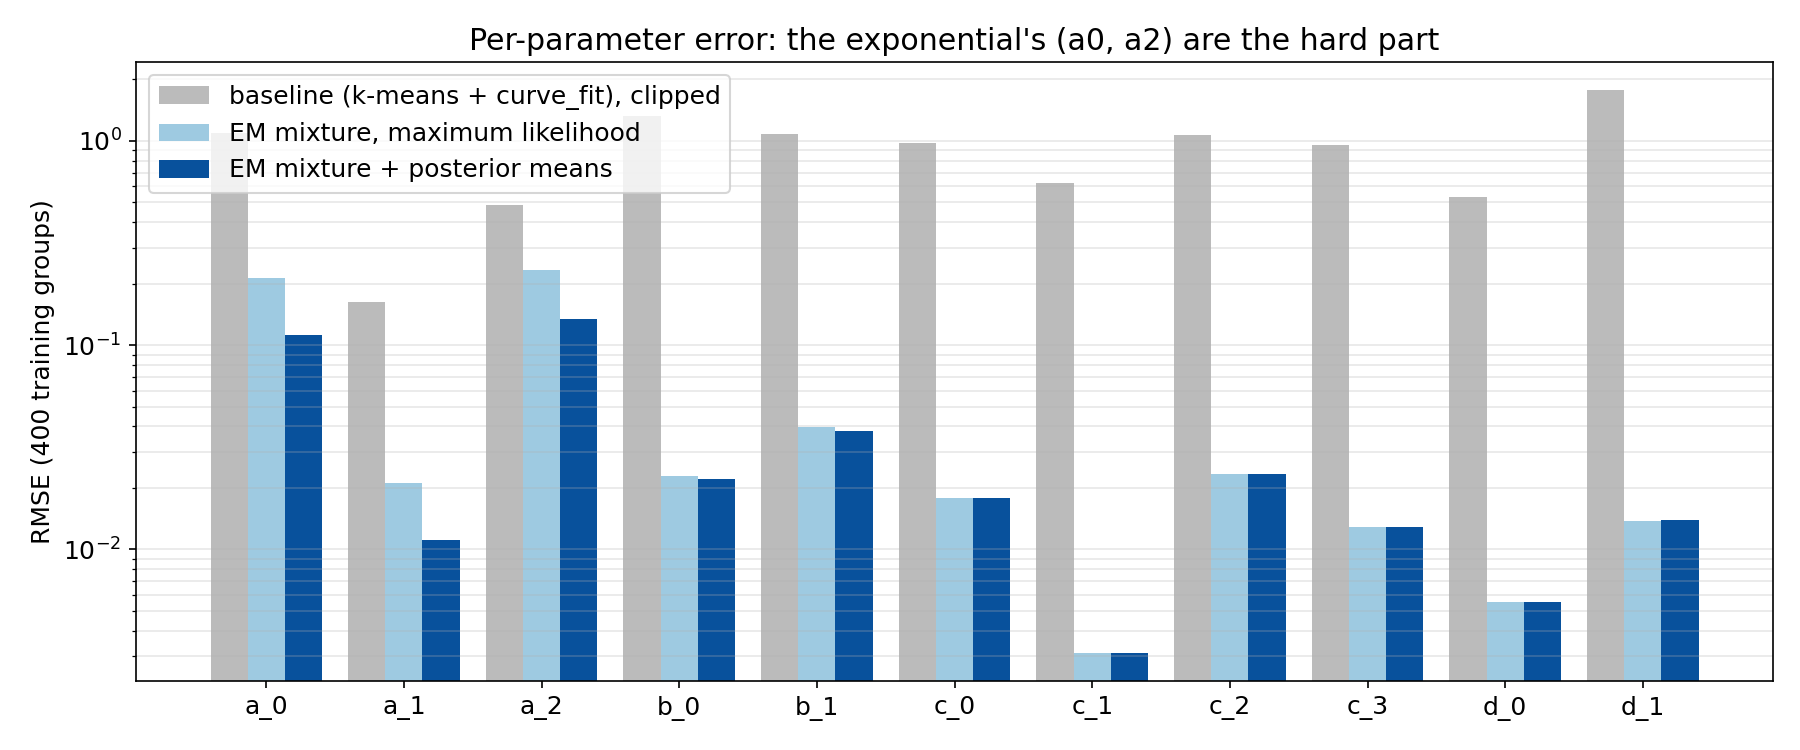
With the baseline at about 1.0 (clipped) or far above (raw), an RMSE of 0.056 is very close to the maximum can give: even a perfect predictor () would leave us above 94 % against the clipped baseline.
What to remember
- When the labels of a mixture are missing, cluster with the model, not with distances. EM on a mixture of regressions assigns points to the curve that explains them.
- EM finds local optima: help it. Annealing (start soft, end sharp), constraints you know to be true (balanced sizes, -ranges, parameter bounds) and explicit moves that escape known traps (swapping two components) matter more than more random restarts.
- Separate linear and nonlinear parameters. Grid search over the one nonlinear parameter plus exact least squares is fast and never diverges.
- Read the data for free priors: histograms revealed the -ranges, the training parameters revealed the box and the noise level.
- Match the estimator to the metric: under squared error the optimal answer is the posterior mean; when a parameter is poorly identified, it beats maximum likelihood by a wide margin.