The problem in brief
Somewhere in the square sits a single source of a central force field: at every point, the force points straight towards or away from the source, and its signed magnitude depends only on the distance . The function is unknown and changes from sample to sample (it can be attractive, repulsive, or switch sign with distance). You observe the force vectors on a grid and must return the source coordinates and at 100 radii . There are 10 000 labelled training samples, 2 000 labelled validation samples and 3 000 test samples (USA AI Olympiad 2026, Round 2, Day 1, Problem 2, data on Hugging Face). The test labels are private, so we report the official metric on the validation set, which we never used for fitting or tuning.
How you are scored
Per sample, lower is better:
averaged over samples. The final mark is relative: , where the baseline is the organisers' CNN that regresses all 102 numbers directly, and is the better of the jury's expert model and the best contestant. None of these reference scores is published, so there is no number to aim for. As a yardstick we use the trivial "" prediction (with a perfect source), which scores 102.9 on validation.
The weights tell you what matters. One grid cell is , so missing the source by one cell costs about 32 points. In the field term, near the source reaches to , so the RMSE is completely dominated by the smallest radius.
First look at the data
Three observations change the whole problem.
- The sources sit exactly on grid nodes: every training and validation source has coordinates , and the field vector at that node is about .
- The sensor saturates. Comparing the observed radial component with the true : up to , the observations equal the truth with roughly 5 % multiplicative noise. Beyond that they flatten at about 25 in absolute value (median ratio observed/true 0.42 for , and 0.08 above 100). The near field is therefore never observed: all you see there is "big, with this sign".
- The metric lives where the data is blind. In our final model, 99.7 % of the squared field error comes from , even though the nearest grid point is 0.032 from the source and the first trustworthy measurement is typically at .
Near-source behaviour varies a lot: the local log-log slope between and ranges from about 2.3 to 3.9 (10th to 90th percentile), and from to . No simple law fits all samples. Two power laws plus an exponential factor fit individual curves to within about 2 % (median), but not exactly, which suggests a mixture of families.
A first baseline
- Source by geometry. Every vector is parallel to , so the source lies on the line through with direction . That gives one linear equation per grid point, . Solving the 4096 equations by least squares (reweighted to trust nearby points more) gives an L1 error of 0.0009, a thirtieth of a cell. Snapping to the nearest grid node then recovers every source exactly: 10 000 / 10 000 in training and 2 000 / 2 000 in validation. The source term of the metric is 0.
- Field by direct reading. Project each vector on the radial direction, , average per radius bin, and interpolate. This scores 102.9, no better than predicting zero. Where the metric cares, the observations are saturated at 25 against true values of and more.
The key idea
Physics gives the source for free. The remaining difficulty is a pure extrapolation problem: predict a function's value at from its values where , typically at , so across almost a decade in radius. No formula can do that for an unknown family, but 10 000 examples of the family can. We learn the map
Two choices make this work.
- Work in space. behaves like for large values and like near zero, so values from to with either sign become numbers between about and that a network can regress.
- Use an L1 loss, i.e. predict the median. The metric is close to , an absolute error on the raw scale. The prediction that minimises an expected absolute error is the conditional median, and since asinh is monotone, the median of maps to the median of . With a squared loss in asinh space, the network learns a geometric-mean-like quantity and its raw-scale error was unstable: it rose from 41 to 215 as training went on.
The full solution
- Source: weighted least-squares line intersection, snapped to the grid.
- Radial profile: average over grid points within of each . Features: of the trusted bins (), a mask of trusted bins, the sign of saturated bins, and the number of points per bin (400 features).
- Field: 3 MLPs (two hidden layers of 512 units, dropout 0.2, weight decay 0.01, 80 epochs, L1 loss on standardised ), averaged in asinh space. At , this is averaged half and half with a gradient-boosting regressor trained with an absolute-error loss.
- For the test set, train on train + validation and write the 102 columns in the sample-submission format.
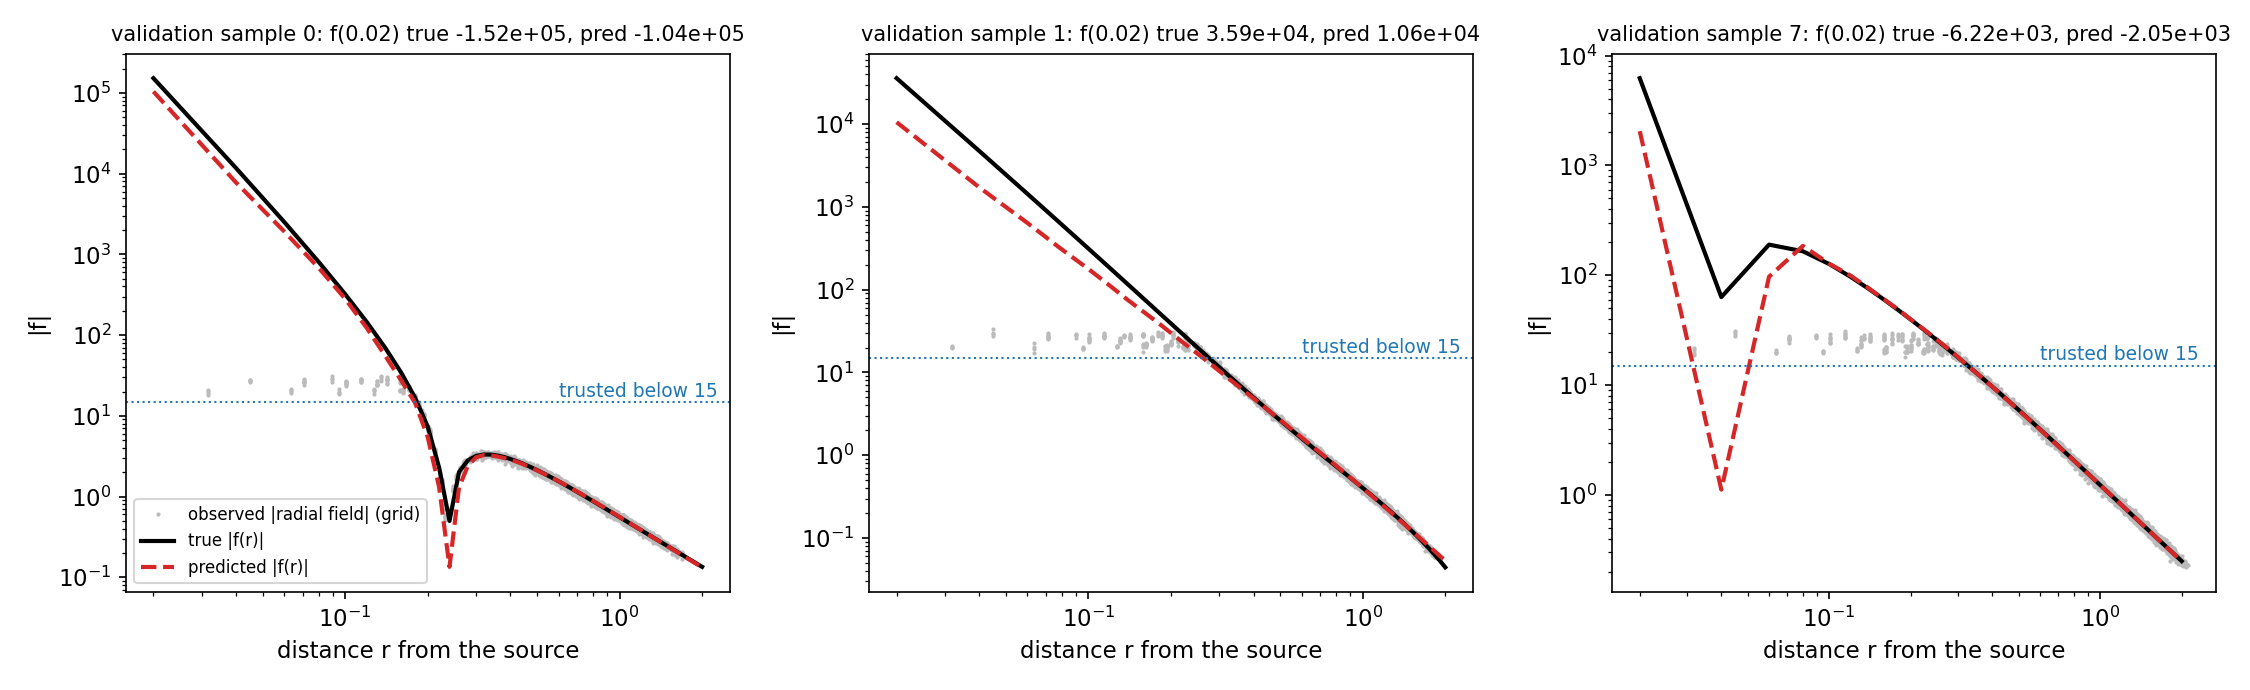
The grey dots show what the grid really measures: below about to they are stuck between 20 and 30, whatever the truth. Sample 0 is a good case, where the steep rise continues the trend seen in the trusted zone. Sample 1 shows the typical error, a near-field slope that is slightly too shallow. Sample 7 is hopeless: the field changes sign inside the saturated zone, which the data cannot reveal.
Results
Official metric on the 2 000 validation samples. Test labels are private, and the organisers' baseline and expert scores are not published.
| approach | source term | field term | score |
|---|---|---|---|
| exact source, | 0.00 | 102.87 | 102.87 |
| exact source, observed profile read directly | 0.00 | 102.86 | 102.86 |
| exact source, MLP with MSE loss in asinh space (best epoch / end) | 0.00 | 40.9 / 215.1 | 40.9 / 215.1 |
| exact source, regularised MLP, MSE loss | 0.00 | 26.8 | 26.8 |
| exact source, gradient boosting at only, MSE / L1 loss | 0.00 | 30.1 / 24.7 | 30.1 / 24.7 |
| exact source, 3 MLPs with L1 loss | 0.00 | 25.1 | 25.1 |
| exact source, 3 MLPs + boosting at (final) | 0.00 | 23.75 | 23.75 |
The remaining error is uncertainty about how steep is below the first unsaturated radius. At the ratio of predicted to true value has median 0.93 (interquartile range 0.69 to 1.21). The prediction is within a factor 1.5 of the truth for 67 % of samples and within a factor 2 for 87 %, and the sign is right for 98.3 %.
What to remember
- Use the physics first: a central field means every vector points at the source, so the location is a linear least-squares problem, and the grid prior makes it exact.
- Look at what the sensor really measures. Saturation turns "fit " into "extrapolate ", a completely different problem.
- Find where the metric's mass is: here one radius out of 100 carries 99.7 % of the error.
- Choose the loss to match the metric. An absolute error calls for the median, which an L1 loss on any monotone transform of the target delivers.
- Targets spanning six orders of magnitude and both signs: regress .