The problem in brief
Using the USDA FoodData Central nutrient tables, you must (1) clean the food data and add ratio features (protein, carbohydrate and fat per kcal, food category), (2) compute the exact energy of a meal given as "150 g apples, 30 g lettuce, ...", build your own dataset of at least 50 meals of 3 to 10 ingredients, and train at least three machine-learning models that predict a meal's energy, evaluated with MAE and RMSE and a true-versus-predicted plot, and (3) for three meals, design an alternative with at least 25 % fewer calories, fewer carbohydrates and a higher share of protein, shown in a comparison table. It is the home round of the Slovak AI Olympiad: an open project graded on quality, originality and explanations.
How you are scored
Out of 100 points, by the jury, on the quality of the result, the ingenuity of the solution and the clarity of the comments. The quantitative parts use
and the alternative meal must satisfy three hard constraints: kcal original, carbohydrates original, protein share of energy original. No reference score exists; what convinces is a sound pipeline and an honest analysis.
First look at the data
- The archive mixes several kinds of records; only the 411
foundation_foodrows are finished foods (the others are lab sub-samples). Several descriptions appear twice (separate analyses): we average them, leaving 303 distinct foods. - Energy is stored in three different nutrients: measured "Energy" (only 135 foods), "Energy (Atwater General Factors)" (322) and "Energy (Atwater Specific Factors)" (312). We take the first available, in that order.
- Cleaning has real consequences: butter and sunflower oil have no energy row in Foundation Foods, so a strict "drop incomplete foods" removes them. Pure fats often lack a carbohydrate row as well; for foods with at least 80 g of fat per 100 g we set the missing carbohydrates to 0, which is the truth, not a guess. Coconut oil is the only oil left with complete data.
The most important observation is not in the data but in the task: the "true" energy of a meal is a formula,
where is the mass of ingredient and its kcal per 100 g. It is linear in the grams. And by the Atwater system, (protein, fat, carbohydrate, in g per 100 g). Any model we train should be judged against that knowledge.
A first baseline
We generate 2 000 random meals (3 to 10 distinct foods, 20 to 300 g each, oils 5 to 40 g, sugar 5 to 50 g, salt 1 to 8 g), compute their exact energy (on average 2 000 kcal, mean absolute deviation from the mean 943 kcal), and split them 80/20. The statement asks for at least 50 meals; with a formula generating the labels for free, more meals is strictly better.
A naive representation describes a meal by its total mass, its number of ingredients and the mass from each food category ("120 g of dairy, 300 g of vegetables..."). Best result: linear regression, MAE 291 kcal. Categories are too coarse: 100 g of "dairy" can be skim milk (34 kcal) or cream cheese (343 kcal).
The key idea
Choose the representation that makes the target simple. The same meal can be written three ways, and the right one turns the problem into something a linear model solves exactly or almost.
- Bag of foods: a 303-dimensional vector with the grams of each food. Since , a linear regression on this vector has the exact answer as its solution: its coefficients are the . It reaches MAE 0.0 on the random test split. But it has learnt a lookup table, one coefficient per food: on meals made of foods it never saw in training, its coefficients are 0 and it collapses (MAE 1 603).
- Macronutrient totals: 4 numbers, the grams of protein, fat, carbohydrate and fibre in the meal. Energy is then a near-linear function shared by all foods. Linear regression learns
which rediscovers the Atwater factors 4, 9, 4 from the data alone. MAE 14 kcal on random test meals, and 23 kcal on meals of never-seen foods: it generalises because it learnt a law, not a table. The residual error comes from foods whose energy was measured or computed with food-specific factors, and from components we did not include (alcohol, polyols). 3. Why the random forest loses everywhere. Trees predict piecewise constants learnt from the training range. Energy is additive and unbounded: a meal with more oil than any training meal gets the energy of the largest leaf, and sums of many small contributions are approximated by a staircase (MAE 59 on macros, 571 on the bag of foods). Gradient-boosted or random forests are excellent on tabular data with interactions; they are the wrong tool for an additive linear law.
The full solution
solution.py does everything in one run (about 30 seconds):
- Load
food.csv,nutrient.csv,food_nutrient.csv; keep foundation foods; pivot the needed nutrients (ids 1008/2047/2048 energy, 1003 protein, 1004 fat, 1005 carbohydrate, 1079 fibre); clean as described; add the ratio features and the category name. - Generate the 2 000 meals and their exact energy; build the three representations.
- Train linear regression, a random forest (300 trees) and an MLP (two hidden layers of 64, standardised inputs) on each representation; report MAE and RMSE on the 400 test meals.
- Generalisation test: hold out 20 % of the foods entirely, train on meals without them, test on 300 meals made only of them.
- Healthier alternatives by linear programming (
scipy.optimize.linprog).
For part 3, every requirement is linear in the grams of ingredients, so the "healthier version" is an optimisation problem, not a guess. Variables: the grams of each original ingredient, of its allowed healthier substitutes (white flour to whole-wheat, oat or defatted soy flour; feta to low-fat cottage cheese; bacon to lean ham; sour cream, whole milk and whole eggs to non-fat yogurt, skim milk and egg whites...) and of optional add-ons (non-fat Greek yogurt, cottage cheese, broccoli). The objective is to change the recipe as little as possible: minimise grams removed plus grams swapped in plus grams added. Constraints:
plus, for each ingredient "slot", at most its original mass and at least half of it (20 % for fats and sugar). The ratio constraint "protein share higher" becomes linear by multiplying out the denominator. The last two lines are our addition: without them the optimiser simply serves a smaller plate (we tried; it met the letter of the task with less protein in absolute terms).
Results
Energy prediction, 400 test meals:
| representation | model | MAE (kcal) | RMSE (kcal) |
|---|---|---|---|
| mass per food category | linear regression | 291.2 | 401.8 |
| mass per food category | random forest | 361.0 | 486.3 |
| mass per food category | MLP | 427.4 | 576.9 |
| grams of each food | linear regression | 0.0 | 0.0 |
| grams of each food | random forest | 570.6 | 774.4 |
| grams of each food | MLP | 284.7 | 375.4 |
| protein / fat / carbs / fibre | linear regression | 14.4 | 22.7 |
| protein / fat / carbs / fibre | random forest | 59.4 | 134.0 |
| protein / fat / carbs / fibre | MLP | 14.8 | 22.9 |
On meals made only of foods unseen in training: bag of foods 1 603 (linear) and 971 (forest); macros 23 (linear) and 82 (forest).
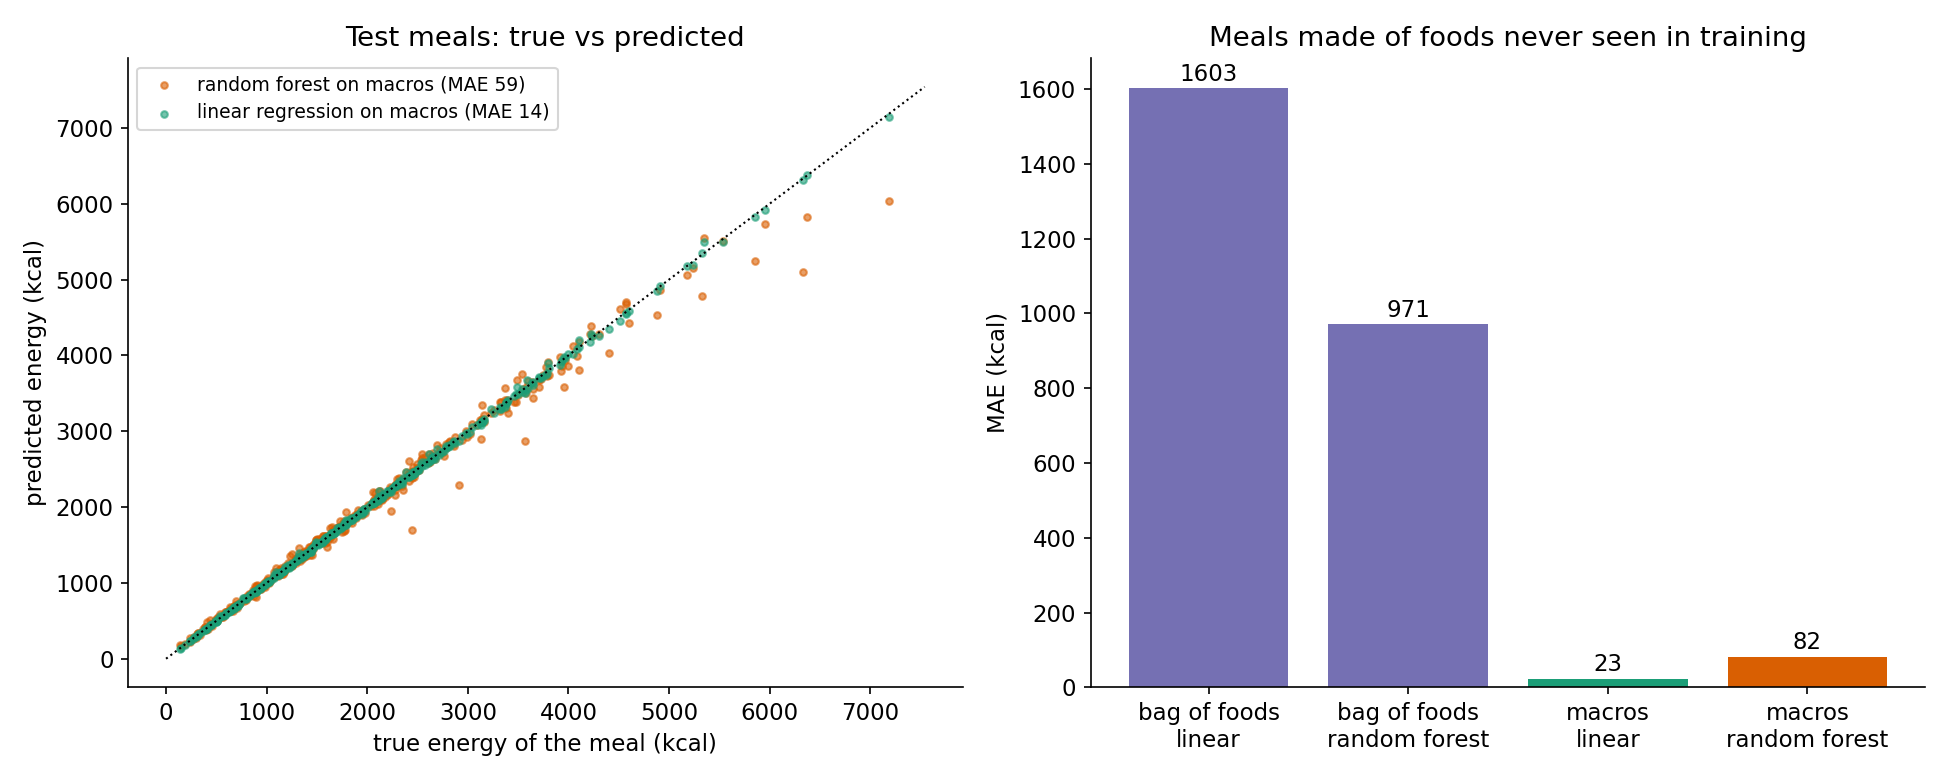
Healthier alternatives (coconut oil and sour cream stand in for the sunflower oil and butter missing from the data; feta stands in for bryndza):
| meal | quantity | original | alternative | change |
|---|---|---|---|---|
| Bryndzové halušky | kcal | 1 475 | 1 076 | % |
| carbohydrates (g) | 179.8 | 104.6 | % | |
| protein (g) | 68.8 | 68.7 | % | |
| fat (g) | 53.4 | 42.4 | % | |
| protein share of energy | 18.7 % | 25.5 % | ||
| Vyprážaný syr with fries | kcal | 1 423 | 1 040 | % |
| carbohydrates (g) | 90.3 | 72.2 | % | |
| protein (g) | 59.4 | 59.7 | % | |
| fat (g) | 93.9 | 57.0 | % | |
| protein share of energy | 16.7 % | 23.0 % | ||
| Palacinky with strawberries | kcal | 1 028 | 748 | % |
| carbohydrates (g) | 147.0 | 101.8 | % | |
| protein (g) | 34.6 | 34.4 | % | |
| fat (g) | 35.0 | 22.8 | % | |
| protein share of energy | 13.5 % | 18.4 % |
What the optimiser chose, in kitchen terms: for halušky, the flour cut from 150 g to 75 g with more than half of it defatted soy flour, less bacon (50 to 20 g) and a spoon of Greek yogurt; for the fried cheese, much less frying fat (40 to 8 g, the single biggest saving) and defatted soy flour instead of white flour in the coating and a little less cheese; for the pancakes, much less sugar and oil and a little less flour. All three meet the three required constraints. The protein changes of to % come from rounding the grams to integers. The LP also produces a few tiny amounts (1 g of flour, 5 g of ham) that a cook would round away: a minimum-amount constraint would need integer variables, a natural extension.
What to remember
- When the target is a known formula, the representation is everything. Energy is linear in grams and almost linear in macronutrients; with those features a linear regression is exact or nearly so, and it even rediscovers the 4/9/4 Atwater factors.
- Test generalisation the way the model will be used. A random split rewarded the lookup table (MAE 0); a split by unseen foods revealed that only the macronutrient model has learnt something transferable.
- Tree ensembles cannot extrapolate an additive law: they predict constants learnt inside the training range.
- Data cleaning decisions change results: missing rows can be "unknown" or "truly zero" (carbohydrates of oil); document each choice.
- "Design a healthier alternative" is an optimisation problem. Write the goals as linear constraints (a ratio constraint becomes linear after multiplying out), choose a sensible objective (smallest change to the recipe), and let a linear-programming solver find it.