The problem in brief
The story: after a (fictional) cyberattack, millions of Singapore public-housing (HDB) resale records lost one column, the storey range of the flat ("01 TO 03", "04 TO 06", up to "49 TO 51"). You get 105 000 intact records (real data.gov.sg transactions from 2017 to 2025: month, town, block, street, flat type and model, floor area, lease dates, resale price) and must recover the storey range of 104 460 damaged records. It is a 17-class classification problem on tabular data, scored by accuracy.
How you are scored
over the test records. The ground truth of the test set is public in the mirror we used, so we report the official test accuracy, after choosing everything on the same 80/20 split of the training set that the starter notebook uses. No threshold, baseline score or leaderboard was published; the reference points are the trivial baselines below.
First look at the data
- Imbalanced, ordered classes. "04 TO 06" alone is 23 % of the records; above floor 18 the classes are rare (3 % in total for the 9 highest ranges). The classes are ordered: confusing floor 5 with floor 8 is a smaller mistake than with floor 35.
- No leaks. Fewer than 0.3 % of test rows coincide with a training row on every feature, so you cannot just look the answers up.
- The storey is priced in, but weakly in raw form. Across the whole dataset, price and storey have a Spearman correlation of only 0.25: a 5-room flat in a cheap town on floor 20 can cost less than a 3-room flat downtown on floor 2. Price is driven first by size, location and the age of the lease.
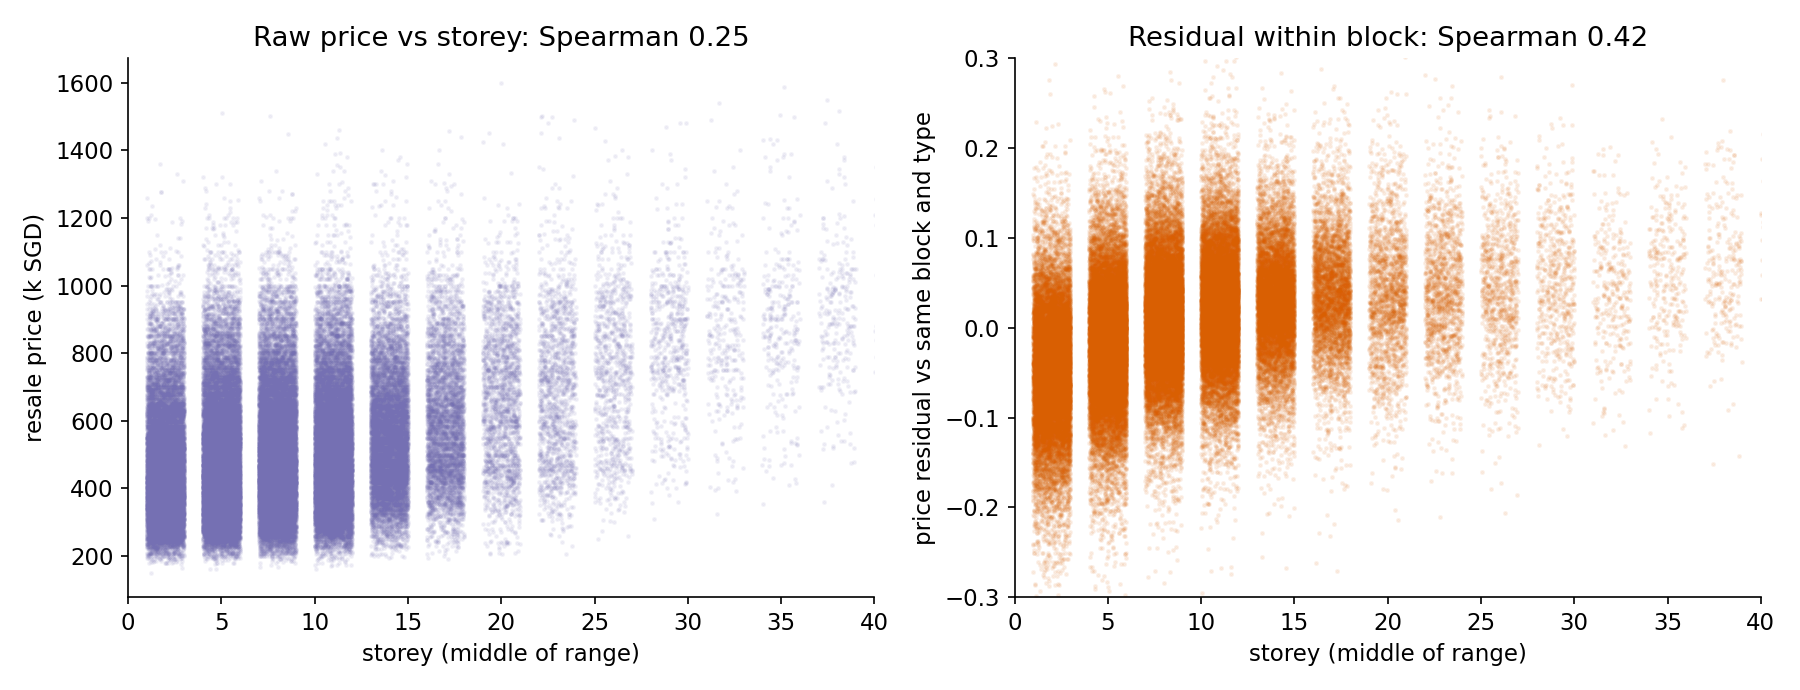
The right panel is the whole idea of this correction: compare each flat with its neighbours in the same block, and the storey effect appears.
A first baseline
| baseline (validation = 20 % of train) | accuracy |
|---|---|
| always predict the most frequent range, "04 TO 06" | 0.230 |
| most frequent range of the same block in training | 0.214 |
| LightGBM 17-class classifier on the raw columns | 0.249 |
A strong learner on the raw columns barely beats the constant guess. The raw table hides the signal: the model would have to learn, for each of the 9 550 blocks separately, what "expensive" means there.
The key idea
Write the log price of a flat as a sum of effects:
Everything except can be estimated without labels, from the prices themselves:
- Remove the market. HDB prices rose by roughly 50 % between 2017 and 2025. Subtract from the log price per square metre the median for the same month and flat type: we get an inflation-free price
adj. - Remove the block. Subtract the mean
adjof all flats of the same block and type (and also within the same block and year), and compute the percentile rank of the flat inside its block. What remains,res_bt, is mostly the storey effect plus noise. - Use the unlabelled rows too. These statistics need no storey label, so we compute them on training and test records together: a block's damaged records still tell us what its typical price is. This is legitimate (no label is touched) and doubles the number of comparables per block.
Then a second insight about the target: the classes are ordered, so treat it as regression. We regress the class index with an L1 (absolute error) loss and round to the nearest class. Why L1? The constant minimising is the median, and for an ordered target the median of the conditional distribution is the natural single guess. The loss also tells the model that missing by one range is much better than missing by five, information a 17-class cross-entropy throws away.
The full solution
- Parse
monthinto a month index,remaining_leaseinto months, build an address keyblock + street. - Price features (train and test together):
log_ppsqm,adj, residuals and ranks within block, within block and type, within block, type and year, plus group sizes and spreads. - LightGBM regression, objective
regression_l1, 600 trees, learning rate 0.05, 63 leaves, at least 40 records per leaf; predict, round, clip to .
idx = d.groupby(["t", "ft"]).log_ppsqm.transform("median")        # market index
d["adj"] = d.log_ppsqm - idx                                        # inflation-free price
g = d.groupby(["addr", "ft"]).adj
d["res_bt"], d["rank_bt"] = d.adj - g.transform("mean"), g.rank(pct=True)
The most important features of the final model (by gain) are, in order, res_bt, the town, res_bty, the lease start year and rank_bt: the block-relative price is by far the strongest signal.
Results
| approach | validation acc. | test acc. |
|---|---|---|
| most frequent class | 0.230 | 0.229 |
| block's most frequent class | 0.214 | |
| LightGBM classifier, raw columns | 0.249 | |
| LightGBM L1 regression, raw columns | 0.279 | |
| hand rule: block's storey range scaled by the price rank in the block | 0.303 | |
| LightGBM classifier, raw + block-relative price | 0.280 | |
| + out-of-fold "storeys seen in this block" statistics (classifier) | 0.243 | |
| LightGBM L1 regression, raw + block-relative price (final) | 0.323 | 0.328 |
| same + out-of-fold block storey statistics | 0.323 | |
| same + "comparable sales" (storeys of the closest-priced labelled flats in the block) | 0.325 |
The final model is right on the exact range 32.8 % of the time on the official test set (against 22.9 % for the constant guess), and within one range 79.1 % of the time.
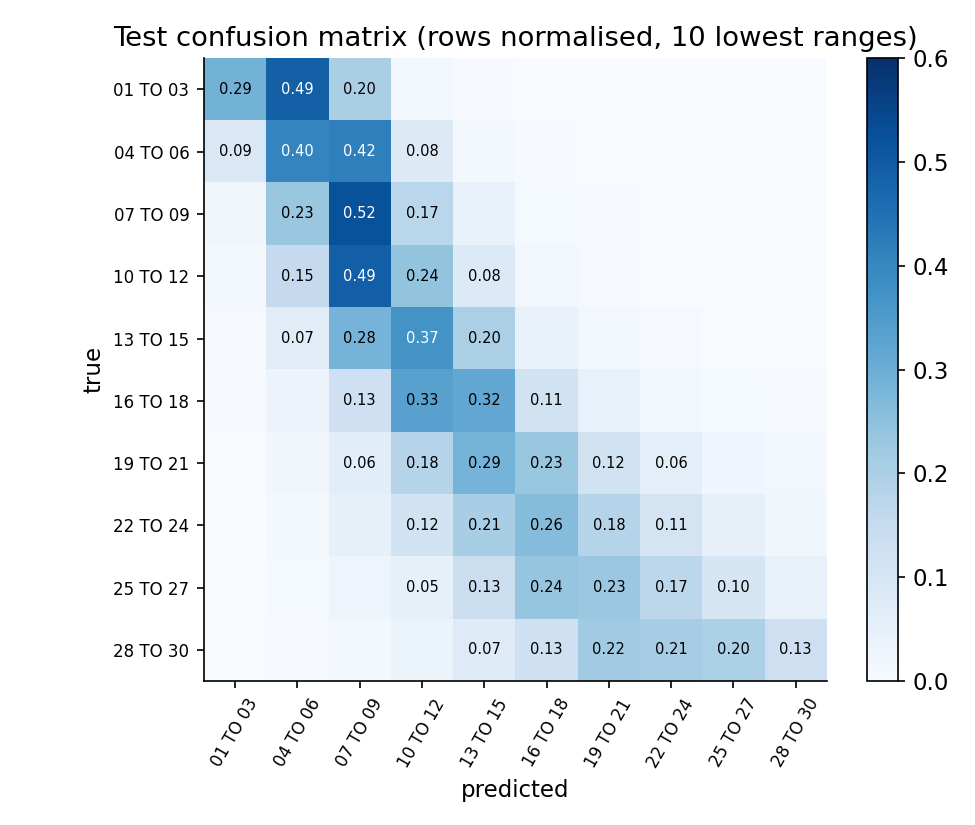
What the failures teach:
-
Regression pulls toward the middle. Flats on floors 1 to 3 are predicted "04 TO 06" half of the time, and high floors are underestimated: when the evidence is weak, the conditional median sits near the bulk of the data. Tuning the rounding thresholds (instead of rounding at .5) is the obvious next step.
-
Out-of-fold target statistics did not help (and hurt the classifier). Blocks have only about 11 labelled sales each, so "which storeys exist in this block" is a noisy estimate, and the block-relative price already carries the useful part. Target encoding is not a free lunch on small groups.
-
Comparable sales (a kNN on price inside the block) added nothing over the residual features: gradient boosting had already extracted that information.
-
The ceiling is real. Within a block, price differences between floors are a few percent, comparable to the noise from renovation, view and negotiation (the right panel above shows heavy overlap between neighbouring floors). An exact-range accuracy around one third, with four out of five predictions within one range, is what the data allows with these features.
What to remember
- Make the comparison explicit. Tree models do not easily compute "this flat versus its block"; residuals and ranks within a group (
groupby().transform) hand them that signal directly. - Remove known trends before comparing (inflation here): a residual is only meaningful once the big effects are gone.
- Unlabelled rows still carry information: group statistics computed on train plus test features use no labels and are fair game.
- Ordered classes deserve an ordinal treatment. Regression with an L1 loss plus rounding beat a 17-class classifier by 4 points of accuracy here.
- Report the honest ceiling and the near misses (within-one accuracy, confusion matrix): on noisy targets they say more than a single accuracy figure.