The problem in brief
Each old photo is given only as a 384-number embedding (the output of some image encoder), and you must guess the year it was taken, between 1900 and 2026. There are 1626 labelled photos and 3022 test photos (twice as many as the training set). The twist: for every photo you may give two guesses, and only the better one counts. The program submitted to Kattis simply prints the 3022 pairs of guesses.
How you are scored
For photo with true year and guesses , the error is the smaller of the two squared errors, and is its mean:
So gives 0 points and gives 100. The test years are private; we evaluate with 5-fold cross-validation on the training set.
First look at the data
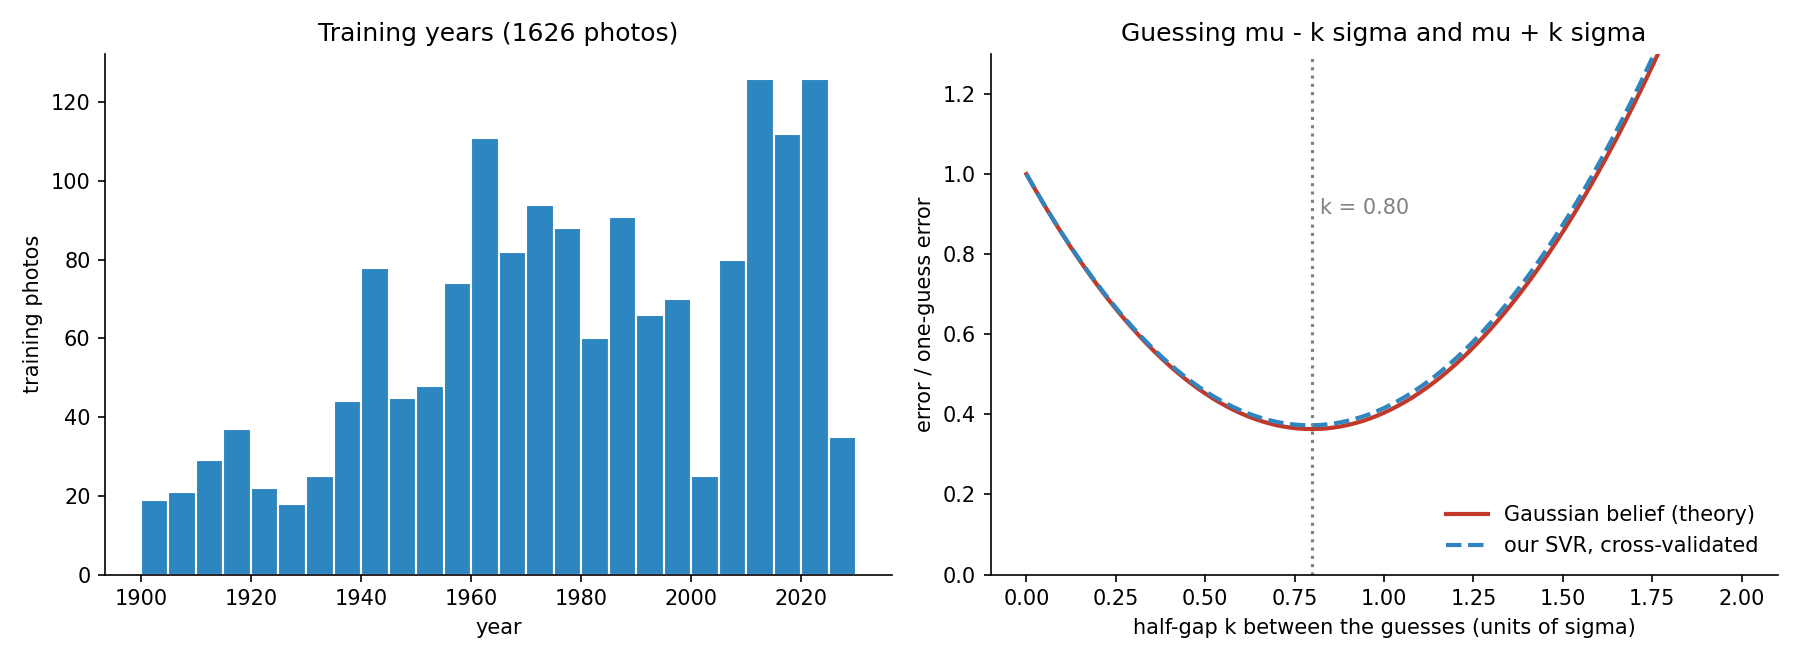
- The years spread over the whole century (standard deviation 33 years), with peaks in the 1960s and the 2010s and a hole around 2000 (left panel of the figure). Predicting the mean year gives a squared error of 1078, far from the 300 needed for even one point.
- The embeddings all have nearly the same length (about 47 to 48), so their direction carries the information: normalising them to unit length and using a cosine-like kernel is natural.
- 1626 examples in 384 dimensions is little data: strongly regularised or kernel models are the right tools, deep networks overfit.
A first baseline
Ridge regression on the embeddings, one guess repeated twice: squared error 471, score 0. A support vector regressor (RBF kernel on normalised embeddings) does better, 389, still 0 points. Even a good single guess cannot reach the scoring range: the photos are genuinely ambiguous, a 1970s street scene and a 1980s one look alike. The two-guess rule is where the points are.
The key idea
Two guesses turn a regression into a small quantisation problem. Suppose your belief about the year of a photo is . With one guess, the best is and the expected error is . With two guesses and (symmetric by symmetry of the belief), write :
because the closer guess is always the one on the same side as , and . Minimising over gives
Two well-placed guesses cut the error by a factor of 2.75. One guess bets on "a bit earlier than my estimate", the other on "a bit later". Our cross-validated SVR follows this theory almost exactly (right panel): its error falls from 389 to 145 at . (This is the same mathematics as the best 1-bit quantiser of a Gaussian signal, or k-means with on the belief distribution.)
Two refinements follow from the same formula.
- A better centre lowers and therefore everything else. We average the SVR with the mean of a predictive distribution from a multinomial logistic regression over 5-year bins: two different models, whose average has a squared error of 375 instead of 389.
- A per-photo spread. is not the same for every photo: some are easy to date, others not. We train a second SVR to predict the absolute error from the embedding (on out-of-fold residuals, so it learns real errors, not training-set errors) and place the guesses at . The predicted spread is a noisy proxy (correlation 0.25 with the actual error), so the best is not exactly 0.8: cross-validation picks . Finally we clip the guesses to : a guess outside the possible range is wasted.
The full solution
- Normalise the embeddings to unit length for the SVRs; standardise them for the logistic regression.
- Centre: , with the middle of 5-year bin .
- Spread: out-of-fold residuals inside the training set, then an SVR to predict them, floored at 2 years.
- Guesses: , rounded to integers.
mu, s = fit_predict(X, y, Xt)                         # centre and per-photo spread
g = np.clip(np.c_[mu - 1.2 * s, mu + 1.2 * s], 1900, 2026)
The evaluation is a nested cross-validation: in each outer fold, the spread model is trained on residuals computed by an inner cross-validation of the training part only.
Results
5-fold cross-validation on the 1626 training photos (the official test labels are private):
| approach | one-guess squared error | two-guess error | score |
|---|---|---|---|
| mean year, twice | 1078 | 1078 | 0 |
| ridge, same guess twice | 471 | 471 | 0 |
| ridge, | 471 | 180 | 60.1 |
| k-nearest neighbours (cosine, ), | 618 | 215 | 42.4 |
| SVR (), | 389 | 145 | 77.4 |
| logistic regression on 5-year bins, best pair under its predicted distribution | 162 | 69.1 | |
| MLP with two outputs trained on the min-loss directly (failed idea) | 159 | 70.5 | |
| SVR + logistic centre, | 375 | 148 | 76.2 |
| same centre, per-photo spread (final) | 375 | 139.5 | 80.3 |
Training a network directly on the "min of two squared errors" loss is elegant but did worse than the simple rule: with 1600 examples it overfits, and it must learn from scratch what the Gaussian argument gives for free. Our was chosen on the same cross-validation it is reported on, so the final number may be slightly optimistic (the choice between and changes it by only 1.6).
What to remember
- Read the metric for hidden freedoms. "Two guesses, the best counts" changes the optimal answer from the mean to a pair around it.
- With two guesses under a Gaussian belief, use : the expected squared error drops from to . The derivation takes three lines and is worth more than any model tuning.
- Predict your own uncertainty. A model of trained on out-of-fold residuals lets you widen the pair for hard photos and tighten it for easy ones.
- Small data, high dimension: kernel methods and regularised linear models beat neural networks here.
- Use the valid range: clipping the guesses to the possible years is free accuracy.