← Retour à l'épreuve

Kazakhstan FAIO 2024 · Correction IOAI Training

I. Ray Is Misbehaving 2: Interference

Cette page donne toute la méthode. Lisez-la une fois que vous avez cherché.

Métrique
exact set of outlier ids
Évaluée sur
simulated tests (official tests are hidden)
Notre score
95-100 % of simulated tests exact
Niveau attendu
exact id set on every hidden test

Nous avons résolu l'épreuve nous-mêmes : téléchargé les données, mené les expériences et mesuré le score ci-dessous. L'énoncé et les données appartiennent à leurs organisateurs. Cette correction est rédigée en anglais.

The problem in brief

Meteorites fly away from the station roughly along one straight line. Ray bumped the gravitational matrix several times, and each bump knocked a meteorite off that common line by more than 40 %. You get the coordinates (x,y,z)(x, y, z) of all meteorites, with z=1z = 1 for every one of them, and must print the ids of the knocked-off ones. In machine-learning terms this is outlier detection with a robust regression: find the line that the majority follows, then flag the points that disagree with it.

How you are scored

Hidden tests compare the printed set of ids with the true set (time limit 1 s). The statement gives neither a sample nor a precise definition of "deviates by more than 40 %", so we have to commit to a reading and test it on our own simulated data:

  • the common line is y=ax+by = a x + b (the coordinate z=1z = 1 carries no information);
  • a meteorite deviates by more than 40 % when its relative deviation exceeds 0.4:
ri=∣yi−(axi+b)∣∣axi+b∣>0.4.r_i = \frac{\lvert y_i - (a x_i + b)\rvert}{\lvert a x_i + b\rvert} > 0.4 .

We score our method by the share of simulated tests where the printed id set is exactly right.

A first baseline

Fit the line by ordinary least squares on all points, then flag every point with ri>0.4r_i > 0.4. It works when nothing is wrong (100 % of tests without outliers) and degrades quickly: 83 % exact with 20 % of knocked-off meteorites, 51 % with 45 %.

The reason is visible in the figure. Least squares minimises ∑i(yi−axi−b)2\sum_i (y_i - a x_i - b)^2, and a point 150 units away weighs as much as 1502=22 500150^2 = 22\,500 points that are 1 unit away. If the bumps push meteorites mostly in one direction, the fitted line is dragged towards them, good meteorites end up outside the band and bad ones inside it. The method uses the outliers to define "normal", which defeats its own purpose.
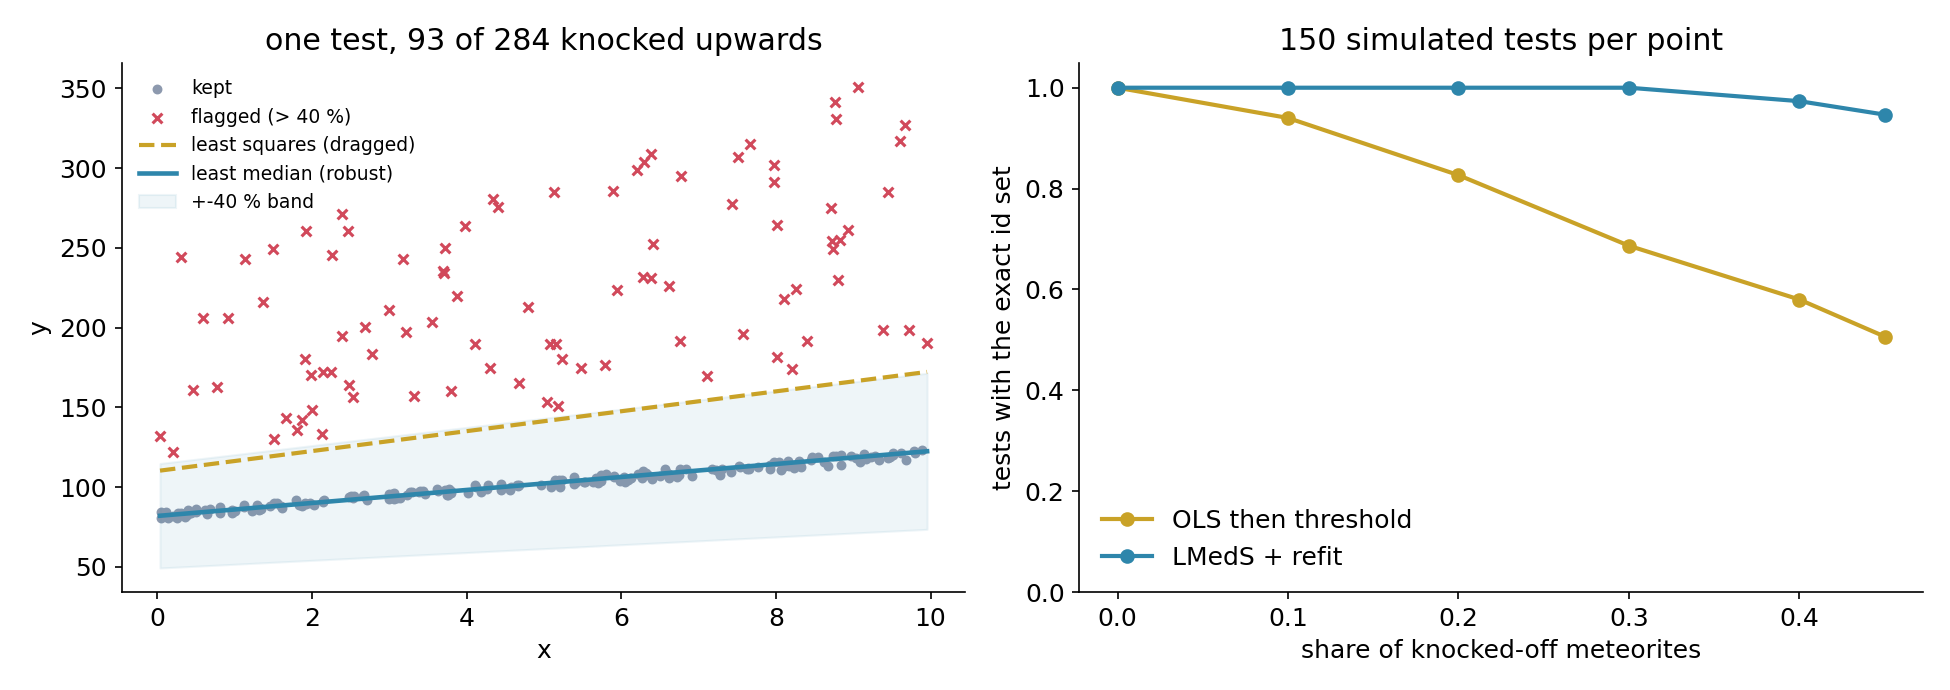
Left: with 93 of 284 meteorites knocked upwards, least squares (dashed) is dragged above the true line, while the least-median line (solid) follows the majority; flagged points are the red crosses outside the 40 % band. Right: share of simulated tests with the exact id set, as the proportion of knocked-off meteorites grows.

The key idea

Fit the line with a statistic that outliers cannot move: the median. Least median of squares (LMedS) chooses the line that minimises the median residual instead of the sum:

(a^,b^)=arg⁡min⁡a,b median⁡i ri(a,b).(\hat{a}, \hat{b}) = \arg\min_{a, b}\ \operatorname{median}_i\ r_i(a, b).

As long as fewer than half of the points are outliers, the median residual is decided by good points only: moving an outlier, even to infinity, does not change it. Statisticians say that LMedS has a breakdown point of 50 %, against 0 % for least squares, where a single point can move the line arbitrarily far.

The minimisation has no formula, but a candidate line only needs two points. So:

  1. pick a random pair of meteorites, take the line through them, compute the median of rir_i over all points;
  2. repeat for 400 random pairs (or all pairs when n≤30n \le 30), keep the line with the smallest median;
  3. refit by least squares on the points within 40 % only (more accurate than a line through 2 points), repeat the selection twice;
  4. print the ids with ri>0.4r_i > 0.4.

Why are 400 pairs enough? If a fraction ε\varepsilon of points are outliers, a random pair is "clean" with probability (1−ε)2(1-\varepsilon)^2, and all 400 draws miss a clean pair with probability (1−(1−ε)2)400\left(1-(1-\varepsilon)^2\right)^{400}. Even with ε=0.45\varepsilon = 0.45, that is 0.6975400≈10−630.6975^{400} \approx 10^{-63}. This sampling argument is the same as in RANSAC, the workhorse of computer vision for fitting models in data full of outliers.

A remark on z=1z = 1: writing points as (x,y,1)(x, y, 1) is the trick of homogeneous coordinates. A line αx+βy+γ=0\alpha x + \beta y + \gamma = 0 becomes n⋅(x,y,1)=0n \cdot (x, y, 1) = 0, and the line through two points is the cross product of their homogeneous vectors. It is elegant (and handles vertical lines), but with the relative-deviation reading above, the slope-intercept form is simpler, so we stay with it.

The full solution

def lmeds_line(xs, ys, trials=400):
    best = (float("inf"), 0.0, 0.0)
    for _ in range(trials):
        i, j = rng.sample(range(n), 2)
        if xs[i] == xs[j]:
            continue
        a = (ys[j] - ys[i]) / (xs[j] - xs[i]); b = ys[i] - a * xs[i]
        med = sorted(rel_dev(a, b, x, y) for x, y in zip(xs, ys))[n // 2]
        if med < best[0]:
            best = (med, a, b)
    return best[1], best[2]

Then find_outliers refits by least squares on the points with ri≤0.4r_i \le 0.4 and prints the others. Everything is pure Python: 400 trials over 1000 points take about 0.2 s. A fixed random seed makes the output reproducible.

Simulated tests (solution.py --bench): 10 to 300 points on a random line kept away from y=0y = 0 (so that relative deviations are meaningful), good meteorites with ±3 %\pm 3\,\% noise, a chosen share of knocked-off meteorites with relative deviations between 45 % and 200 %, in either direction; 150 tests per outlier share.

Results

Share of simulated tests with the exact id set:

share of knocked-off meteorites00.10.20.30.40.45
least squares, then threshold1.0000.9400.8270.6870.5800.507
LMedS + least-squares refit on inliers1.0001.0001.0001.0000.9730.947

The few LMedS misses at 40 to 45 % come from tests where, by chance, the knocked-off meteorites are close to half of the points: then even the median is no longer protected. Beyond 50 % the problem itself becomes ill-posed, since the "common line" is no longer the majority.

Honest caveat: the official tests are hidden and the statement is vague, so the exact definition of "40 %" (relative to yy, to the distance from the line, or to something else) is our interpretation. The robust-fitting part of the solution does not depend on it; only the final rel_dev function would change.

What to remember

  • Least squares is not robust: one far point can move the fit anywhere, so never detect outliers with a model fitted on the outliers.
  • The median resists contamination up to 50 %: least median of squares fits the majority, whatever the minority does.
  • Fit from minimal random samples (two points for a line) and keep the best by a robust score: this is RANSAC, used everywhere in vision (image stitching, 3-D reconstruction).
  • Refit on the inliers once they are known: robustness first, then precision.
  • When a statement is vague, state your interpretation and isolate it in one function, so that changing your reading is a one-line edit.
Code complet (solution.py)
"""FAIO 2024 (Kazakhstan) qualification, problem I
"Ray Is Misbehaving 2: Interference".

Meteorites (id, x, y, z = 1) lie roughly on one straight line, except some
that were knocked off it by more than 40 %. Print the ids of those.

Reading of the statement used here (it gives no example): the common line is
y = a x + b, and a meteorite "deviates by more than 40 %" when its relative
deviation |y - (a x + b)| / |a x + b| exceeds 0.4. The line must be found
ROBUSTLY: ordinary least squares is dragged by the very outliers we hunt.

Method: least median of squares (LMedS). Draw many pairs of points, take the
line through each pair, keep the line whose MEDIAN relative deviation is
smallest (outliers can be up to ~half of the points without fooling it),
refit by least squares on the points it calls inliers, and flag the rest.

    python solution.py < input.txt   -> ids of deviated meteorites
    python solution.py --bench       -> simulated tests + figures
Pure standard library in the submission path.
"""
import sys
import random

THRESH = 0.40


def rel_dev(a, b, x, y):
    yh = a * x + b
    return abs(y - yh) / abs(yh) if yh != 0 else float("inf")


def ls_line(xs, ys):
    n = len(xs); mx = sum(xs) / n; my = sum(ys) / n
    sxx = sum((x - mx) ** 2 for x in xs)
    if sxx == 0:
        return 0.0, my
    a = sum((x - mx) * (y - my) for x, y in zip(xs, ys)) / sxx
    return a, my - a * mx


def lmeds_line(xs, ys, trials=400, seed=0):
    rng = random.Random(seed)
    n = len(xs); best = (float("inf"), 0.0, 0.0)
    pairs = [(i, j) for i in range(n) for j in range(i + 1, n)] if n <= 30 else None
    for k in range(len(pairs) if pairs else trials):
        i, j = pairs[k] if pairs else rng.sample(range(n), 2)
        if xs[i] == xs[j]:
            continue
        a = (ys[j] - ys[i]) / (xs[j] - xs[i]); b = ys[i] - a * xs[i]
        devs = sorted(rel_dev(a, b, x, y) for x, y in zip(xs, ys))
        med = devs[n // 2]
        if med < best[0]:
            best = (med, a, b)
    return best[1], best[2]


def find_outliers(ids, xs, ys):
    if len(xs) < 3:
        return []
    a, b = lmeds_line(xs, ys)
    for _ in range(3):                               # refit on the inliers, twice is enough
        keep = [k for k in range(len(xs)) if rel_dev(a, b, xs[k], ys[k]) <= THRESH]
        if len(keep) >= 2:
            a, b = ls_line([xs[k] for k in keep], [ys[k] for k in keep])
    return [ids[k] for k in range(len(xs)) if rel_dev(a, b, xs[k], ys[k]) > THRESH]


def main_stdin():
    tok = sys.stdin.read().split()
    n = int(tok[0]); ids, xs, ys = [], [], []
    for k in range(n):
        i, x, y, _z = tok[1 + 4 * k: 5 + 4 * k]
        ids.append(i); xs.append(float(x)); ys.append(float(y))
    print(" ".join(find_outliers(ids, xs, ys)))


# ------------------------------------------------------------------ benchmark
def bench():
    import numpy as np
    import matplotlib
    matplotlib.use("Agg")
    import matplotlib.pyplot as plt
    rng = np.random.default_rng(1)

    def gen(frac, noise=0.03, one_sided=False):
        n = int(rng.integers(10, 300))
        a, b = rng.uniform(-5, 5), rng.uniform(20, 100)
        x = rng.uniform(0, 10, n)
        if a < 0:
            x = x * min(1.0, 0.6 * b / (10 * -a))        # keep the line far from y = 0
        y = (a * x + b) * (1 + rng.uniform(-noise, noise, n))
        out = rng.random(n) < frac
        u = rng.uniform(0.45, 2.0, n) * (1 if one_sided else rng.choice([-1, 1], n))
        y[out] = (a * x[out] + b) * (1 + u[out])
        return [str(i + 1) for i in range(n)], x.tolist(), y.tolist(), \
            {str(i + 1) for i in np.flatnonzero(out)}

    def ols_outliers(ids, xs, ys):
        a, b = ls_line(xs, ys)
        return [i for i, x, y in zip(ids, xs, ys) if rel_dev(a, b, x, y) > THRESH]

    fracs = [0.0, 0.1, 0.2, 0.3, 0.4, 0.45]
    res = {"OLS then threshold": [], "LMedS + refit": []}
    for f in fracs:
        tests = [gen(f) for _ in range(150)]
        for name, fn in [("OLS then threshold", ols_outliers), ("LMedS + refit", find_outliers)]:
            ok = np.mean([set(fn(ids, xs, ys)) == truth for ids, xs, ys, truth in tests])
            res[name].append(ok)
            print(f"outlier share {f:.2f}  {name:20s} exact-match rate {ok:.3f}")

    plt.rcParams.update({"font.size": 12, "axes.spines.top": False, "axes.spines.right": False})
    rng = np.random.default_rng(7)
    ids, xs, ys, truth = gen(0.3, one_sided=True)
    xs_a, ys_a = np.array(xs), np.array(ys)
    a0, b0 = ls_line(xs, ys); a1, b1 = lmeds_line(xs, ys)
    found = set(find_outliers(ids, xs, ys))
    fig, axs = plt.subplots(1, 2, figsize=(13, 4.6), dpi=150)
    mask = np.array([i in found for i in ids])
    axs[0].scatter(xs_a[~mask], ys_a[~mask], s=14, color="#8d99ae", label="kept")
    axs[0].scatter(xs_a[mask], ys_a[mask], s=22, color="#d1495b", marker="x", label="flagged (> 40 %)")
    g = np.linspace(xs_a.min(), xs_a.max(), 50)
    axs[0].plot(g, a0 * g + b0, "--", color="#c9a227", lw=2, label="least squares (dragged)")
    axs[0].plot(g, a1 * g + b1, color="#2e86ab", lw=2.2, label="least median (robust)")
    axs[0].fill_between(g, 0.6 * (a1 * g + b1), 1.4 * (a1 * g + b1), color="#2e86ab", alpha=0.08,
                        label="+-40 % band")
    axs[0].set_xlabel("x"); axs[0].set_ylabel("y"); axs[0].set_title(f"one test, {len(truth)} of {len(ids)} knocked upwards")
    axs[0].legend(frameon=False, fontsize=9)
    for name, col in [("OLS then threshold", "#c9a227"), ("LMedS + refit", "#2e86ab")]:
        axs[1].plot(fracs, res[name], "o-", color=col, lw=2, label=name)
    axs[1].set_xlabel("share of knocked-off meteorites"); axs[1].set_ylabel("tests with the exact id set")
    axs[1].set_ylim(0, 1.05); axs[1].set_title("150 simulated tests per point"); axs[1].legend(frameon=False)
    fig.tight_layout(); fig.savefig("figures/robust_fit.png", facecolor="white")
    print("figure written")


if __name__ == "__main__":
    bench() if "--bench" in sys.argv else main_stdin()