The problem in brief
A radioactive sample loses half of its mass every seconds, so its mass follows . You receive up to 1000 measured pairs (mass, time), which are noisy, and your program must print the half-life . Neither nor the noise level is given. It is a curve-fitting problem: one unknown curve, two parameters, a cloud of imperfect points.
How you are scored
Each hidden test is worth 100 points if your estimate satisfies
and 0 otherwise; the final score is the average over the tests. The tests are hidden on Yandex Contest, so we cannot report an official score. Instead we check the sample (exact data, : our program prints ) and benchmark on 900 simulated tests with realistic noise (section "Results").
A first baseline
Take logarithms. Since , the points lie on a straight line with slope
Fit that line by least squares, with . Setting gives the classic closed form
That is ten lines of Python, no library needed, and it is already a good solution: on our simulated tests it lands within 1 % between 73 % and 89 % of the time depending on the noise.
The key idea
Taking a logarithm straightens the curve, but it also reshapes the noise. Least squares treats every point as equally reliable, which is only right if the errors on all have the same size. Whether they do depends on how the measurements are perturbed:
- Multiplicative noise, (a relative error, like "the scale is accurate to 5 %"). Then : the error on the log is the same size everywhere. Plain least squares on the logs is exactly right.
- Additive noise, (an absolute error, like "accurate to 20 mg"). Now, to first order,
so the error on the log is inflated by . Late measurements, when little mass is left, become extremely noisy in log scale (the fan on the right of the figure), and plain least squares lets them drag the slope.
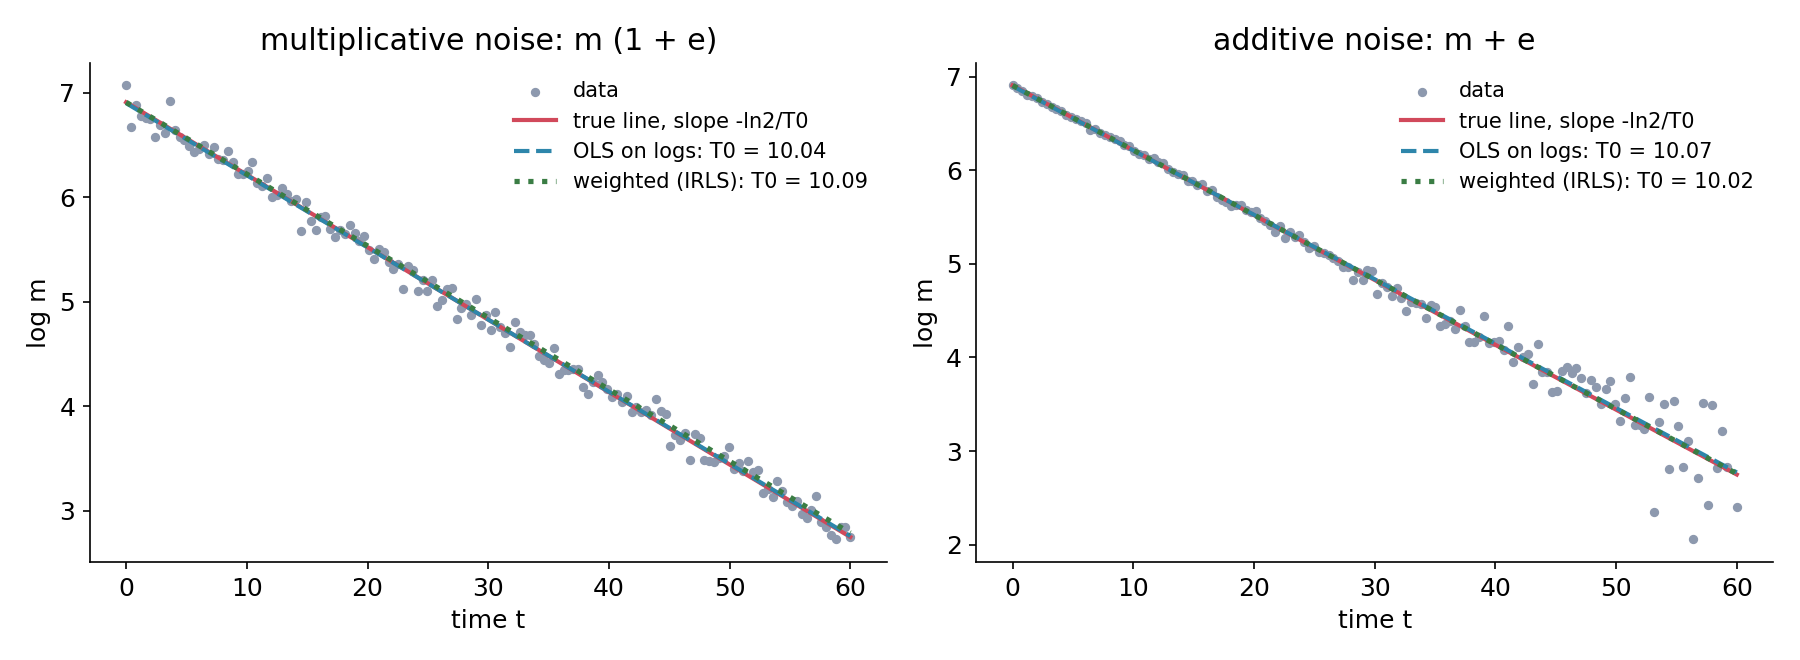
The cure is weighted least squares: give each point a weight equal to the inverse of its error variance, . Since the true is unknown, use the current fit and iterate (iteratively reweighted least squares, IRLS):
- fit the line with all weights equal to 1;
- set ;
- refit with these weights, repeat until stable.
At convergence this is (to first order) the same as fitting the original curve directly to the masses by least squares, which is the right estimator for additive noise.
Which model is the right one? The data can tell you. After a first fit, look at the absolute residuals . Under multiplicative noise they shrink with the mass; under additive noise they do not depend on it. A rank correlation (Spearman) between and above about 0.25 means multiplicative noise, so we keep plain least squares; otherwise we switch to IRLS. This is a tiny example of residual diagnostics, the habit of checking the assumptions of a model on its own errors.
The full solution
The submission uses only math, because a contest judge may not have NumPy. The core is one weighted line fit:
def weighted_line(t, y, w):
    sw = sum(w)
    mt = sum(wi * ti for wi, ti in zip(w, t)) / sw
    my = sum(wi * yi for wi, yi in zip(w, y)) / sw
    stt = sum(wi * (ti - mt) ** 2 for wi, ti in zip(w, t))
    sty = sum(wi * (ti - mt) * (yi - my) for wi, ti, yi in zip(w, t, y))
    a = sty / stt
    return a, my - a * mt
On top of it: half_life_ols (all weights 1), half_life_irls (30 reweighting rounds with , normalised to avoid overflow), and half_life, which runs the Spearman test and picks one. With fewer than 8 points the test is meaningless and we keep the plain fit. Pay attention to the input order: each line is "mass time", not "time mass".
The --bench mode of solution.py simulates tests in the statement's ranges: , between 5 and 2000, up to 10 000, observation window of 1 to 4 half-lives (capped at ), points with removed as the constraints require.
Results
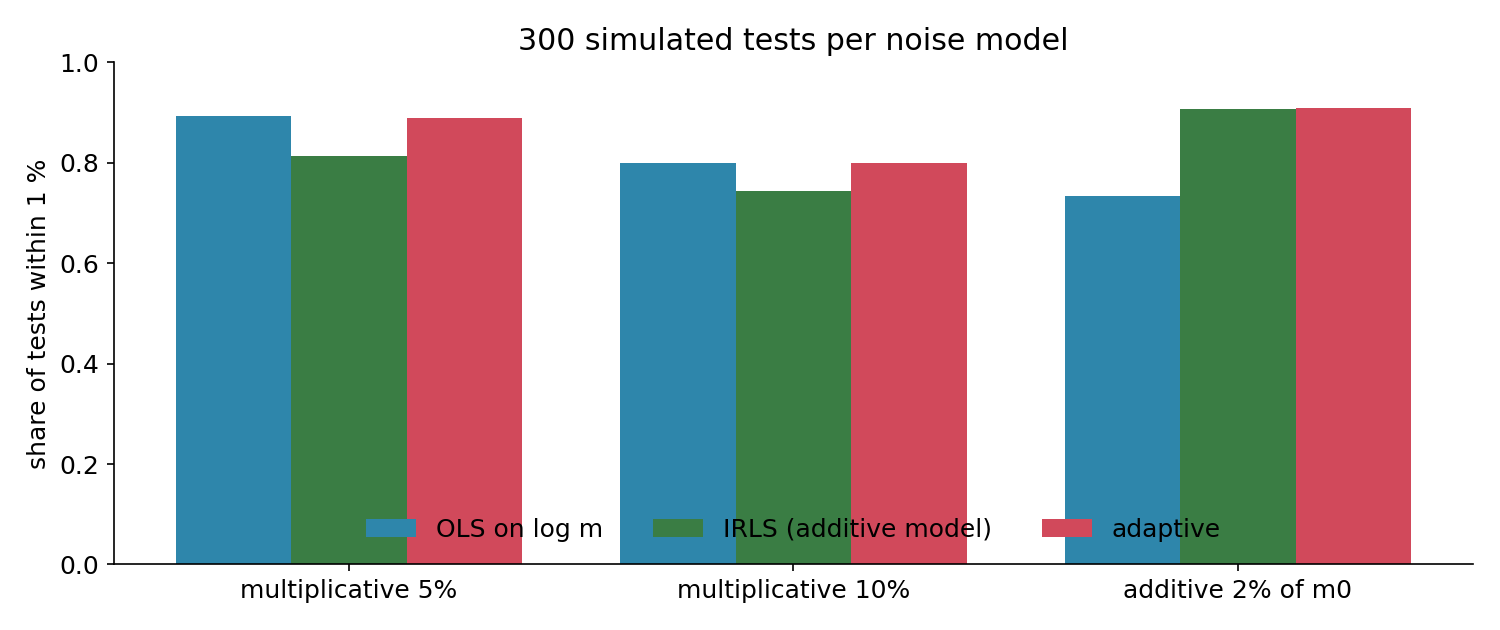
Share of 300 simulated tests per noise model that land within 1 % (same tests for every method):
| approach | mult. 5 % | mult. 10 % (uniform) | additive, 2 % of |
|---|---|---|---|
| least squares on | 0.893 | 0.800 | 0.733 |
| IRLS, weights (additive model) | 0.813 | 0.743 | 0.907 |
| weights from the raw data (tried, dropped) | 0.80 | 0.75 | 0.70 |
| adaptive (Spearman test picks the model) | 0.890 | 0.800 | 0.910 |
Two lessons hide in this table. First, a weighting that is right for one noise model is wrong for the other: there is no universally best fit, only an estimator matched to the noise. Second, the remaining 10 to 20 % failures are not bugs: with a handful of points or a short observation window, the statistical uncertainty on the slope is itself larger than 1 %, and no method can beat it. (The standard error of the slope is about : few points or a narrow time range make it large.)
The real tests are unknown to us; on the official sample, whose data are exact, every method returns (the sample output is within the 1 % tolerance too).
What to remember
- Linearise with the right transform: exponential decay becomes a line in , and the half-life is .
- A transform changes the noise as well as the curve. After , an absolute error becomes : small values become unreliable.
- Weight each point by the inverse of its error variance; when that variance depends on the unknown fit, iterate (IRLS).
- Diagnose the noise from the residuals instead of guessing: their behaviour against the fitted value tells you which model holds.
- Benchmark on simulated data when the tests are hidden: generating your own tests with known answers is the only way to compare methods honestly.