The problem in brief
You are handed small 64 by 64 colour pictures of emoji, each pasted on a plain background, and must write a function that says whether a picture shows a face (label 1) or a flag (label 2). The training set is tiny: 160 labelled images, 80 of each. The test set (310 images) was only released in the last hour of the contest, so there is no way to adapt to it: whatever rule you write must already be right. The notebook nudges you towards hand-crafted features (colour histograms, pixel loops) rather than deep learning, and external emoji data is forbidden.
The organisers later published the test labels, so everything below is scored on the official test set with the official metric.
How you are scored
The metric is plain accuracy on the 310 test images,
turned into points relative to the best contestant:
with 0 points at or below the 50 % baseline. The best contestant's accuracy is not published, so there is no fixed target: you get 100 points only if nobody does better than you.
First look at the data
Plot a grid of the training images and the job looks almost insultingly easy. Every training face is a yellow Apple smiley, every flag a waving Apple flag. A rule like "is the picture mostly yellow?" separates the 160 training images perfectly.
Now look at the test set (we only did this after choosing our rule, but it is the lesson of the problem):
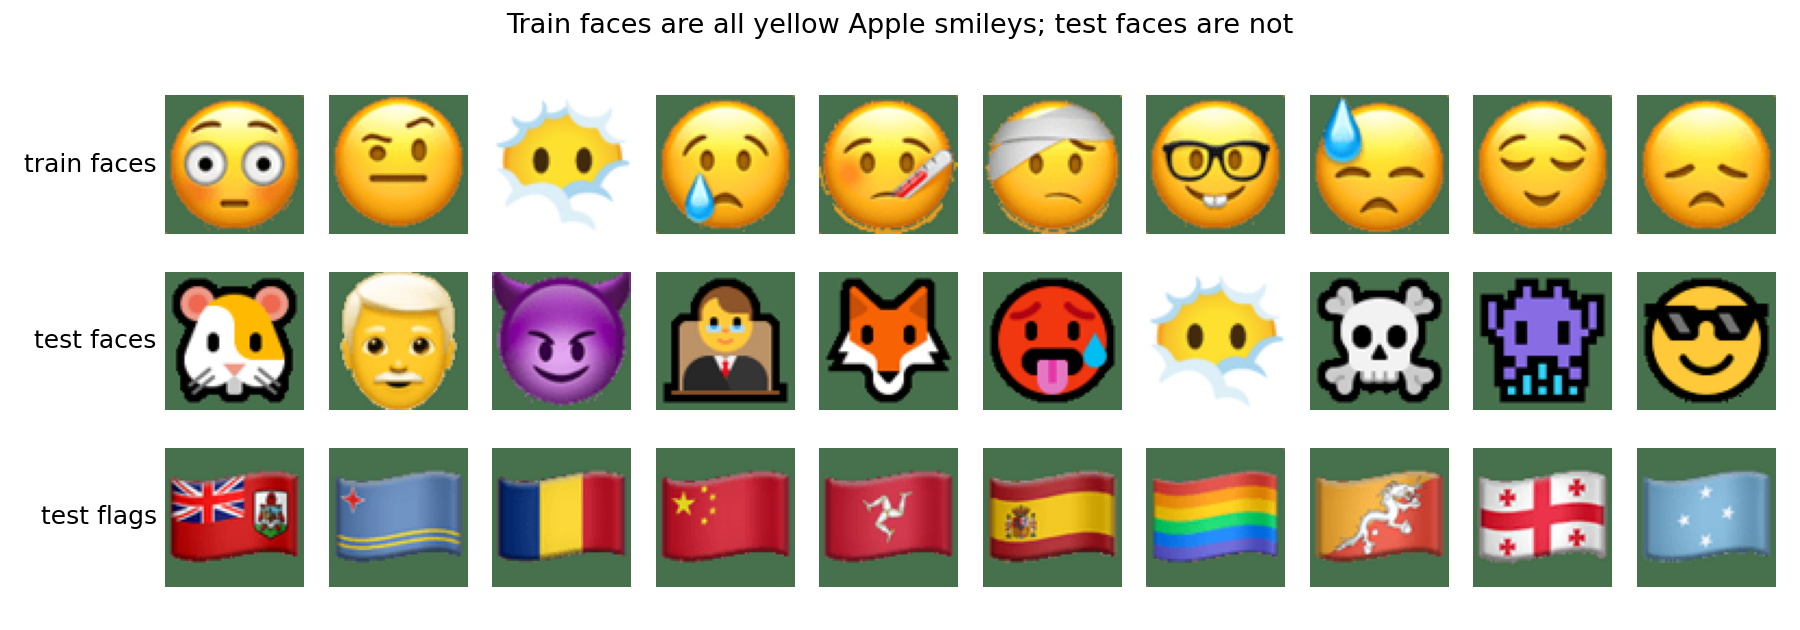
The test faces come from other emoji designs (thick black outlines, flat colours) and are often not yellow at all: a hamster, a fox, a purple devil, a skull, a red face, a person with grey hair. Meanwhile many test flags are full of yellow (Spain, Romania, Bhutan). This is a textbook distribution shift: the training set is not a fair sample of the test set. Any feature that only happens to separate the training classes will collapse.
Two small practical details matter for feature extraction:
- the background is a flat green (71, 112, 76) on most images and white on a few, so we take it as the most frequent colour on the image border;
- about a third of the training images carry one or two stray pixels near the edges, so when measuring the silhouette we ignore rows and columns with fewer than 3 object pixels.
A first baseline
The "obvious" feature: the fraction of yellow pixels (, , ) inside the silhouette. On train, faces have between 29 % and 79 % yellow, flags at most 21 %, so a threshold at the midpoint (about 0.25) is 100 % correct on train.
On test it gets 64.2 %. Barely better than the 50 % baseline. Learned models on raw pixels or colour histograms fail in exactly the same way, because they too latch on to colour:
| model (fitted on the 160 training images) | train acc. | test acc. |
|---|---|---|
| yellow fraction > 0.25 | 100 % | 64.2 % |
| 1-nearest neighbour on raw pixels | 100 % | 68.4 % |
| logistic regression on raw pixels | 100 % | 66.8 % |
| 1-nearest neighbour on a 64-bin colour histogram | 100 % | 71.0 % |
Perfect training accuracy tells you nothing here: 160 images of one design can be separated by dozens of features, and most of them are accidents.
The key idea
Ask what makes a face a face and a flag a flag, whatever the artist. It is not the colour, which depends on the design and the subject. It is the shape of the object: an emoji face is drawn as a disc (or a head) that fills the whole square canvas, while a flag is a rectangle with a 3:2 or 2:1 ratio, so it only fills about two thirds of the canvas height. Every emoji set obeys this, because it is how the symbols are defined.
Once you see it, one number is enough: the height of the silhouette's bounding box. On the training set,
a gap of 14 pixels. We put the threshold in the middle of the gap, face, using the training data only. Putting a threshold at the midpoint of the largest gap is the one-feature version of a maximum-margin classifier (a 1-D SVM): it leaves as much room as possible on both sides for new images that look a little different, which is exactly what a distribution shift will throw at you.
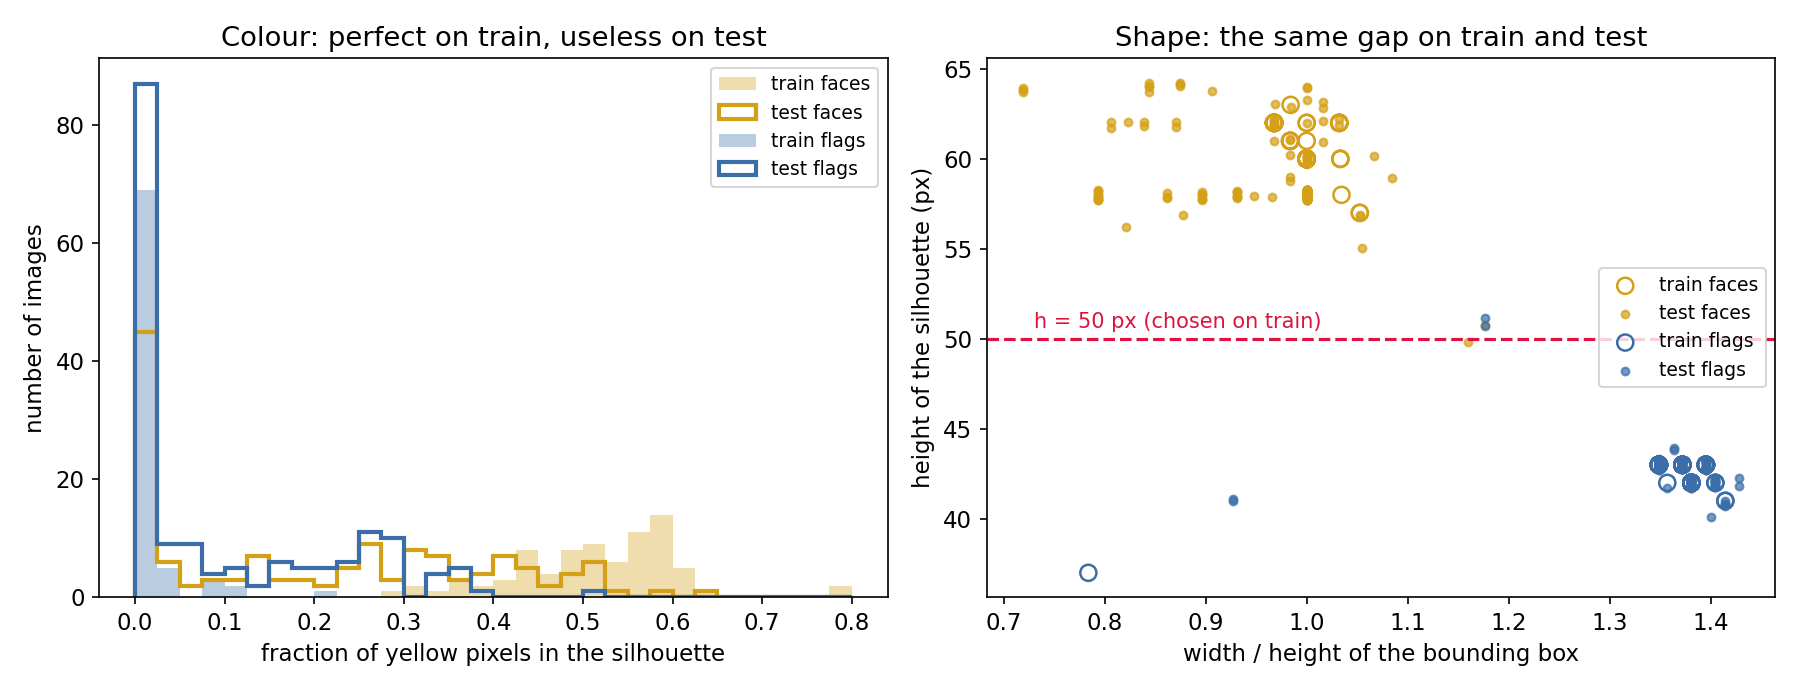
The left panel shows the colour feature falling apart: test faces (orange outline) spread across the whole range, test flags pile up where train faces used to be. The right panel shows the shape feature holding firm: test faces still sit high (55 to 64 px), test flags still sit low (40 to 44 px). The colour feature captured how the training images were drawn; the height captures what they are.
Why not use the aspect ratio instead? It works almost as well (98.7 %), but it is less robust: faces with ears, hair or a hat are wider than tall, and the square flags of Switzerland and the Vatican have , like a face. Their height (41 px) still says "flag".
The full solution
- Background: the most frequent colour on the border. Mask: pixels whose colour differs from it by more than 40 (sum of absolute RGB differences).
- Bounding box: first and last row (column) containing at least 3 mask pixels, so stray pixels are ignored.
- Decision: face if the box is at least 50 px tall, flag otherwise.
def prediksi_gambar_img(img):
    pred_label = 1 if shape_features(img)["h"] >= 50 else 2
    return int(pred_label)
There is nothing to train beyond reading the two height ranges off the training set, which is the point: with 160 examples of a single design, a rule with one parameter chosen for a physical reason generalises far better than a model with thousands of parameters.
Results
All numbers are on the official 310-image test set (140 faces, 170 flags); every rule was fixed on the training set first.
| approach | train acc. | test acc. | points if best = ours |
|---|---|---|---|
| yellow fraction | 100 % | 64.2 % | 29 |
| 1-NN on raw pixels | 100 % | 68.4 % | 37 |
| 1-NN on colour histogram | 100 % | 71.0 % | 42 |
| mirror symmetry of the mask (waving flags are asymmetric) | 96.3 % | 92.6 % | 86 |
| fill ratio of the bounding box | 98.8 % | 90.3 % | 82 |
| aspect ratio | 99.4 % | 98.7 % | 99 |
| silhouette height | 100 % | 99.35 % | 100 |
The final rule makes 2 mistakes out of 310:
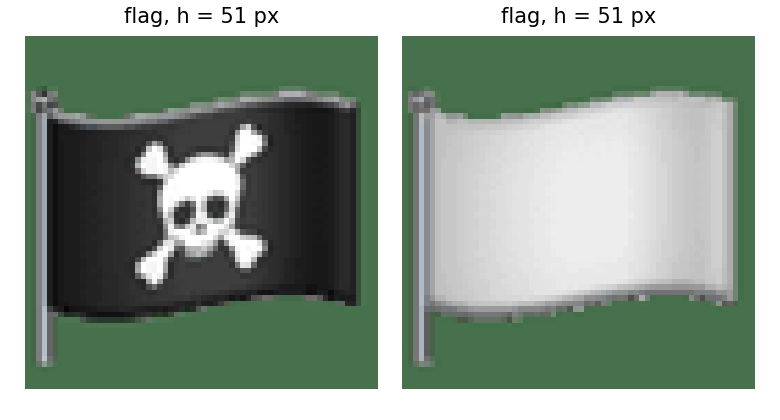
Both are flags drawn with a flagpole (the pirate flag and the white flag), and the pole sticks out below the cloth, raising the height to 51 px. The training set contains no flag on a pole, so no rule chosen on train could anticipate it. You could fix it (the bottom rows of these images contain only the thin pole), but we found that by looking at the test errors, so it would be tuning on the test set: we do not count it. Note also that one test face sits exactly at : the margin is real but not huge, which is a fair warning about how far a single feature can carry you.
What to remember
- Perfect training accuracy is not evidence of anything when the training set is small and homogeneous. Ask how the test data could differ, and check that your features would survive it.
- Prefer features tied to the definition of the classes (a flag is a rectangle, a face is round) over features tied to how the examples happen to be drawn (Apple's yellow).
- Put thresholds in the middle of the gap, not at the edge of one class: the maximum-margin choice is the one that tolerates shift best.
- Robust measurement matters: take the background from the data, ignore stray pixels. Two lines of care turn a fragile feature into a reliable one.
- Read your test errors, but do not fix them with the test set: note them as the next thing to improve and keep the reported score honest.