The problem in brief
You receive one year of daily temperatures (365 numbers in a NumPy file) and must compute six descriptive statistics: the mean, the standard deviation, the variance, the kurtosis, the skewness, and the cumulative moving average (CMA), the average of all days up to each day. The answer is a CSV with one row per day: the day's temperature, its CMA, and the five global statistics repeated on every row. The statement also mentions a "pollution" field, but the file contains only temperatures.
The data are the official Kaggle file. Kaggle's grader is not public and we did not submit anything. Every value below was computed twice, with library calls and with the formulas written out by hand, and both agree to .
How you are scored
The Evaluation page only says that the submission is judged on the correctness of the computed values, with for any value you could not compute. It gives no formula and no tolerance. On the public leaderboard the best score is 1.1, reached by two entries, followed by 0.9. The scale is not explained.
First look at the data
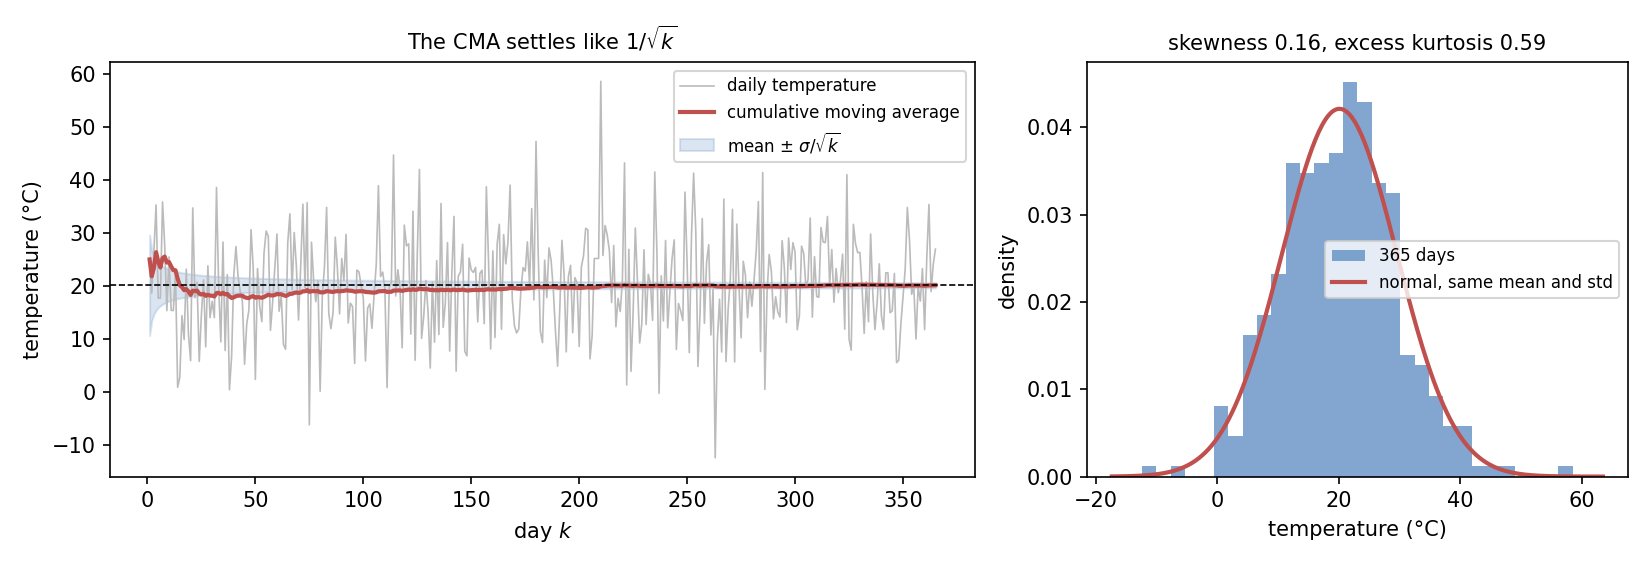
The 365 values run from °C to °C, with no missing values. A histogram looks very much like a bell curve (right panel below). It is in fact exactly one: the array equals 20 + 10 * np.random.randn(365) after np.random.seed(42), to the last digit. The "temperatures" are a normal sample with true mean 20 and true standard deviation 10. That tells us what the answers should be close to, which is a useful sanity check.
The key idea
Every statistic here is a moment of the data. Write for the mean and for the -th central moment:
Then
Skewness and kurtosis are moments of the standardised data , so they have no unit and do not change if you convert to Fahrenheit. The makes the kurtosis of a normal distribution equal to 0.
The only real difficulty is that several conventions exist, and the statement does not pick one:
| quantity | divide by (library default) | other common convention |
|---|---|---|
| variance | 89.6338 (np.var) | 89.8801, divide by (ddof=1, pandas) |
| standard deviation | 9.4675 (np.std) | 9.4805, divide by |
| kurtosis | 0.5913, excess (scipy.stats.kurtosis) | 3.5913 Pearson (fisher=False), 0.6161 bias-corrected |
| skewness | 0.1587 (scipy.stats.skew) | 0.1593 bias-corrected |
We use the defaults of NumPy and SciPy (left column), which treat the 365 days as the whole population. Beware of mixing libraries: pandas.Series.std() divides by , while np.std divides by , and pandas.Series.kurt() is the bias-corrected version.
The CMA has a neat closed form. The CMA of day is , which is just the running sum divided by the day number:
cma = np.cumsum(t) / np.arange(1, n + 1)
That is one pass over the data. Recomputing the average from scratch for each day would cost operations, which is the trap the statement's remark on efficiency points to. The equivalent incremental update, useful when data arrive one day at a time, is
The full solution
- Load the array with
np.load(..., allow_pickle=False). - Compute the mean,
np.std,np.var,scipy.stats.kurtosisandscipy.stats.skew, and the CMA with a cumulative sum. - Recompute everything from the moment formulas and with a day-by-day loop for the CMA, and assert that the two agree.
- Write the 365-row CSV in the requested column order.
Results
| statistic | value |
|---|---|
| mean | 20.0995 °C |
| standard deviation (divide by ) | 9.4675 °C |
| variance (divide by ) | 89.6338 °C² |
| excess kurtosis | 0.5913 |
| skewness | 0.1587 |
| CMA on day 1 / day 2 / day 365 | 24.967 / 21.792 / 20.0995 |
The last CMA equals the mean, as it must.
Do these numbers make sense? The mean and standard deviation are close to the true 20 and 10: the standard error of the mean is , and we are 0.1 away. For a normal sample of size , skewness and excess kurtosis have standard errors of about and . Our skewness (0.16) is unremarkable. The kurtosis (0.59) is 2.3 standard errors above 0, and one single day explains it: the 58.5 °C day lies 4.06 standard deviations above the mean, and without it the kurtosis falls to 0.12 and the skewness to 0.01. The fourth power makes kurtosis extremely sensitive to the most extreme points. The left panel shows the CMA wandering early and settling as days accumulate, inside a band that shrinks like .
What to remember
- Mean, variance, skewness and kurtosis are the first four moments, the last two computed on standardised data. Writing them by hand once is the best way to remember what each measures.
- State your conventions. versus , excess versus Pearson kurtosis, biased versus corrected estimators: libraries disagree (NumPy divides by , pandas by ), and a grader expects one of them.
- Cumulative quantities are cumulative sums.
np.cumsumturns an loop into , and the incremental update works on streaming data. - Higher moments are fragile. One extreme value out of 365 moved the kurtosis from 0.12 to 0.59. Look at the extremes before interpreting a kurtosis.
- Sanity-check against what the data should be. Knowing the expected value and the standard error of each statistic tells you at once whether a result is plausible or a bug.